
Page 50 - Read Online
P. 50
Page 57 Ryan et al. J Transl Genet Genom. 2025;9:48-61 https://dx.doi.org/10.20517/jtgg.2024.87
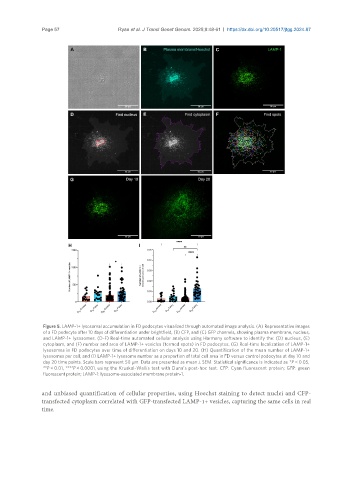
Figure 5. LAMP-1+ lysosomal accumulation in FD podocytes visualized through automated image analysis. (A) Representative images
of a FD podocyte after 10 days of differentiation under brightfield, (B) CFP, and (C) GFP channels, showing plasma membrane, nucleus,
and LAMP-1+ lysosomes. (D-F) Real-time automated cellular analysis using Harmony software to identify the: (D) nucleus, (E)
cytoplasm, and (F) number and area of LAMP-1+ vesicles (termed spots) in FD podocytes. (G) Real-time localization of LAMP-1+
lysosomes in FD podocytes over time of differentiation on days 10 and 20. (H) Quantification of the mean number of LAMP-1+
lysosomes per cell; and (I) LAMP-1+ lysosome number as a proportion of total cell area in FD versus control podocytes at day 10 and
day 20 time points. Scale bars represent 50 µm. Data are presented as mean ± SEM. Statistical significance is indicated as *P < 0.05,
**P < 0.01, ****P < 0.0001, using the Kruskal-Wallis test with Dunn’s post-hoc test. CFP: Cyan fluorescent protein; GFP: green
fluorescent protein; LAMP-1: lysosome-associated membrane protein-1.
and unbiased quantification of cellular properties, using Hoechst staining to detect nuclei and CFP-
transfected cytoplasm correlated with GFP-transfected LAMP-1+ vesicles, capturing the same cells in real
time.