
Page 47 - Read Online
P. 47
Ryan et al. J Transl Genet Genom. 2025;9:48-61 https://dx.doi.org/10.20517/jtgg.2024.87 Page 54
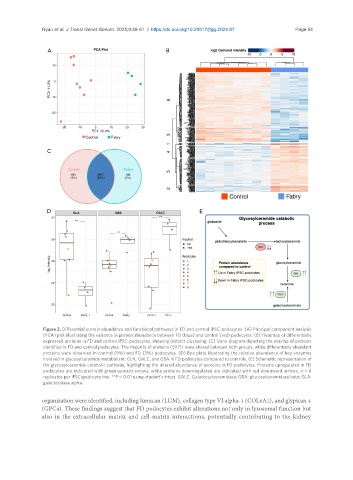
Figure 2. Differential protein abundance and functional pathways in FD and control iPSC-podocytes. (A) Principal component analysis
(PCA) plot illustrating the variance in protein abundance between FD (blue) and control (red) podocytes. (B) Heatmap of differentially
expressed proteins in FD and control iPSC-podocytes, showing distinct clustering. (C) Venn diagram depicting the overlap of proteins
identified in FD and control podocytes. The majority of proteins (5971) were shared between both groups, while differentially abundant
proteins were observed in control (9%) and FD (3%) podocytes. (D) Box plots illustrating the relative abundance of key enzymes
involved in glycosylceramide metabolism: GLA, GALC, and GBA in FD podocytes compared to controls. (E) Schematic representation of
the glycosylceramide catabolic pathway, highlighting the altered abundance of proteins in FD podocytes. Proteins upregulated in FD
podocytes are indicated with green upward arrows, while proteins downregulated are indicated with red downward arrows. n = 4
replicates per iPSC-podocyte line. **P < 0.01 using student’s t-test. GALC: Galactosylceramidase; GBA: glucosylceramidase beta; GLA:
galactosidase alpha.
organization were identified, including lumican (LUM), collagen type VI alpha-1 (COL6A1), and glypican 4
(GPC4). These findings suggest that FD podocytes exhibit alterations not only in lysosomal function but
also in the extracellular matrix and cell-matrix interactions, potentially contributing to the kidney