
Page 49 - Read Online
P. 49
Ryan et al. J Transl Genet Genom. 2025;9:48-61 https://dx.doi.org/10.20517/jtgg.2024.87 Page 56
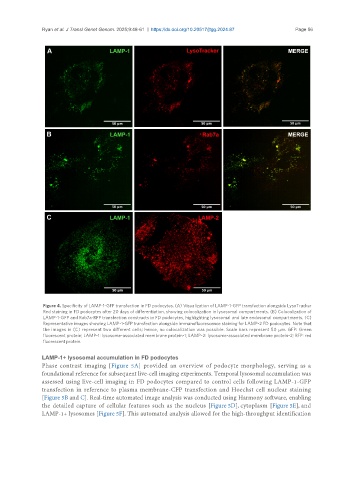
Figure 4. Specificity of LAMP-1-GFP transfection in FD podocytes. (A) Visualization of LAMP-1-GFP transfection alongside LysoTracker
Red staining in FD podocytes after 20 days of differentiation, showing colocalization in lysosomal compartments. (B) Colocalization of
LAMP-1-GFP and Rab7a-RFP transfection constructs in FD podocytes, highlighting lysosomal and late endosomal compartments. (C)
Representative images showing LAMP-1-GFP transfection alongside immunofluorescence staining for LAMP-2 FD podocytes. Note that
the images in (C) represent two different cells; hence, no colocalization was possible. Scale bars represent 50 µm. GFP: Green
fluorescent protein; LAMP-1: lysosome-associated membrane protein-1; LAMP-2: lysosome-associated membrane protein-2; RFP: red
fluorescent protein.
LAMP-1+ lysosomal accumulation in FD podocytes
Phase contrast imaging [Figure 5A] provided an overview of podocyte morphology, serving as a
foundational reference for subsequent live-cell imaging experiments. Temporal lysosomal accumulation was
assessed using live-cell imaging in FD podocytes compared to control cells following LAMP-1-GFP
transfection in reference to plasma membrane-CFP transfection and Hoechst cell nuclear staining
[Figure 5B and C]. Real-time automated image analysis was conducted using Harmony software, enabling
the detailed capture of cellular features such as the nucleus [Figure 5D], cytoplasm [Figure 5E], and
LAMP-1+ lysosomes [Figure 5F]. This automated analysis allowed for the high-throughput identification