
Page 46 - Read Online
P. 46
Page 53 Ryan et al. J Transl Genet Genom. 2025;9:48-61 https://dx.doi.org/10.20517/jtgg.2024.87
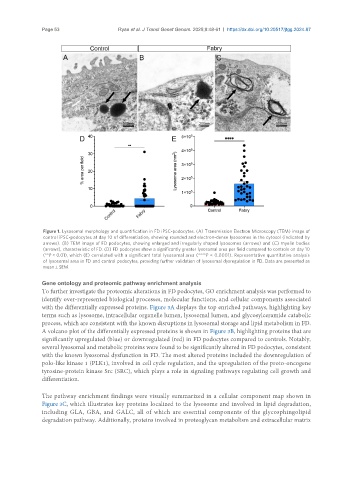
Figure 1. Lysosomal morphology and quantification in FD iPSC-podocytes. (A) Transmission Electron Microscopy (TEM) image of
control iPSC-podocytes at day 10 of differentiation, showing rounded and electron-dense lysosomes in the cytosol (indicated by
arrows). (B) TEM image of FD podocytes, showing enlarged and irregularly shaped lysosomes (arrows) and (C) myelin bodies
(arrows), characteristic of FD. (D) FD podocytes show a significantly greater lysosomal area per field compared to controls on day 10
(**P < 0.01), which (E) correlated with a significant total lysosomal area (****P < 0.0001). Representative quantitative analysis
of lysosomal area in FD and control podocytes, providing further validation of lysosomal dysregulation in FD. Data are presented as
mean ± SEM.
Gene ontology and proteomic pathway enrichment analysis
To further investigate the proteomic alterations in FD podocytes, GO enrichment analysis was performed to
identify over-represented biological processes, molecular functions, and cellular components associated
with the differentially expressed proteins. Figure 3A displays the top enriched pathways, highlighting key
terms such as lysosome, intracellular organelle lumen, lysosomal lumen, and glycosylceramide catabolic
process, which are consistent with the known disruptions in lysosomal storage and lipid metabolism in FD.
A volcano plot of the differentially expressed proteins is shown in Figure 3B, highlighting proteins that are
significantly upregulated (blue) or downregulated (red) in FD podocytes compared to controls. Notably,
several lysosomal and metabolic proteins were found to be significantly altered in FD podocytes, consistent
with the known lysosomal dysfunction in FD. The most altered proteins included the downregulation of
polo-like kinase 1 (PLK1), involved in cell cycle regulation, and the upregulation of the proto-oncogene
tyrosine-protein kinase Src (SRC), which plays a role in signaling pathways regulating cell growth and
differentiation.
The pathway enrichment findings were visually summarized in a cellular component map shown in
Figure 3C, which illustrates key proteins localized to the lysosome and involved in lipid degradation,
including GLA, GBA, and GALC, all of which are essential components of the glycosphingolipid
degradation pathway. Additionally, proteins involved in proteoglycan metabolism and extracellular matrix