
Page 31 - Read Online
P. 31
Zhang et al. J Transl Genet Genom 2018;2:18. I https://doi.org/10.20517/jtgg.2018.22 Page 7 of 11
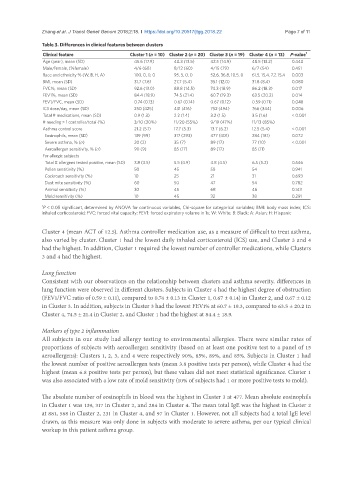
Table 3. Differences in clinical features between clusters
Clinical feature Cluster 1 (n = 10) Cluster 2 (n = 20) Cluster 3 (n = 19) Cluster 4 (n = 13) P-value 1
Age (year), mean (SD) 45.6 (17.9) 40.3 (13.5) 42.5 (14.9) 48.5 (13.2) 0.440
Male/female, (%female) 4/6 (60) 8/12 (60) 4/15 (79) 6/7 (54) 0.451
Race and ethnicity % (W, B, H, A) 100, 0, 0, 0 95, 5, 0, 0 52.6, 36.8, 10.5, 0 61.5, 15.4, 7.7, 15.4 0.003
BMI, mean (SD) 31.7 (7.6) 27.7 (5.4) 35.1 (12.0) 31.8 (8.4) 0.080
FVC%, mean (SD) 92.6 (13.0) 88.8 (14.5) 74.3 (18.9) 86.2 (18.3) 0.017
FEV1%, mean (SD) 84.4 (18.9) 74.5 (21.4) 60.7 (19.3) 63.5 (20.2) 0.014
FEV1/FVC, mean (SD) 0.74 (0.13) 0.67 (0.14) 0.67 (0.12) 0.59 (0.11) 0.048
ICS dose/day, mean (SD) 250 (425) 431 (416) 752 (494) 766 (344) 0.006
Total # medications, mean (SD) 0.9 (1.3) 2.2 (1.4) 3.2 (1.5) 3.5 (1.6) < 0.001
# needing > 1 controller/total (%) 3/10 (30%) 11/20 (55%) 9/19 (47%) 11/13 (85%)
Asthma control score 21.2 (5.1) 17.7 (5.3) 13.7 (6.2) 12.5 (5.4) < 0.001
Eosinophils, mean (SD) 139 (99) 317 (293) 477 (401) 284 (181) 0.072
Severe asthma, % (n) 20 (2) 35 (7) 89 (17) 77 (10) < 0.001
Aeroallergen sensitivity, % (n) 90 (9) 85 (17) 89 (17) 85 (11)
For allergic subjects
Total # allergens tested positive, mean (SD) 3.8 (3.5) 5.5 (4.9) 4.8 (4.5) 6.5 (5.2) 0.546
Pollen sensitivity (%) 50 45 58 54 0.941
Cockroach sensitivity (%) 10 25 21 31 0.693
Dust mite sensitivity (%) 60 50 47 54 0.782
Animal sensitivity (%) 30 45 68 46 0.143
Mold sensitivity (%) 10 45 32 38 0.291
1 P < 0.05 significant, determined by ANOVA for continuous variables, Chi-square for categorical variables; BMI: body mass index; ICS:
inhaled corticosteroid; FVC: forced vital capacity; FEV1: forced expiratory volume in 1s; W: White; B: Black; A: Asian; H: Hispanic
Cluster 4 (mean ACT of 12.5). Asthma controller medication use, as a measure of difficult to treat asthma,
also varied by cluster. Cluster 1 had the lowest daily inhaled corticosteroid (ICS) use, and Cluster 3 and 4
had the highest. In addition, Cluster 1 required the lowest number of controller medications, while Clusters
3 and 4 had the highest.
Lung function
Consistent with our observations on the relationship between clusters and asthma severity, differences in
lung function were observed in different clusters. Subjects in Cluster 4 had the highest degree of obstruction
(FEV1/FVC ratio of 0.59 ± 0.11), compared to 0.74 ± 0.13 in Cluster 1, 0.67 ± 0.14) in Cluster 2, and 0.67 ± 0.12
in Cluster 3. In addition, subjects in Cluster 3 had the lowest FEV1% at 60.7 ± 19.3, compared to 63.5 ± 20.2 in
Cluster 4, 74.5 ± 21.4 in Cluster 2, and Cluster 1 had the highest at 84.4 ± 18.9.
Markers of type 2 inflammation
All subjects in our study had allergy testing to environmental allergies. There were similar rates of
proportions of subjects with aeroallergen sensitivity (based on at least one positive test to a panel of 15
aeroallergens): Clusters 1, 2, 3, and 4 were respectively 90%, 85%, 89%, and 85%. Subjects in Cluster 1 had
the lowest number of positive aeroallergen tests (mean 3.8 positive tests per person), while Cluster 4 had the
highest (mean 6.8 positive tests per person), but these values did not meet statistical significance. Cluster 1
was also associated with a low rate of mold sensitivity (10% of subjects had 1 or more positive tests to mold).
The absolute number of eosinophils in blood was the highest in Cluster 3 at 477. Mean absolute eosinophils
in Cluster 1 was 139, 317 in Cluster 2, and 284 in Cluster 4. The mean total IgE was the highest in Cluster 2
at 881, 588 in Cluster 2, 231 in Cluster 4, and 97 in Cluster 1. However, not all subjects had a total IgE level
drawn, as this measure was only done in subjects with moderate to severe asthma, per our typical clinical
workup in this patient asthma group.