
Page 29 - Read Online
P. 29
Zhang et al. J Transl Genet Genom 2018;2:18. I https://doi.org/10.20517/jtgg.2018.22 Page 5 of 11
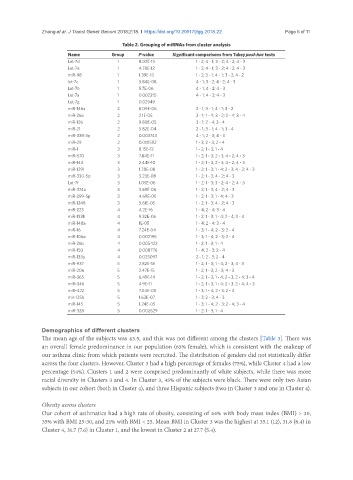
Table 2. Grouping of miRNAs from cluster analysis
Name Group P-value Significant comparisons from Tukey post-hoc tests
Let-7d 1 8.02E-13 1 - 2; 4 - 1; 3 - 2; 4 - 2; 4 - 3
Let-7e 1 4.78E-12 1 - 2; 4 - 1; 3 - 2; 4 - 2; 4 - 3
miR-98 1 1.39E-10 1 - 2; 3 - 1; 4 - 1; 3 - 2; 4 - 2
let-7c 1 5.84E-08 4 - 1; 3 - 2; 4 - 2; 4 - 3
Let-7b 1 5.7E-06 4 - 1; 4 - 2; 4 - 3
Let-7a 1 0.002215 4 - 1; 4 - 2; 4 - 3
Let-7g 1 0.02949
miR-146a 2 8.09E-06 2 - 1; 3 - 1; 4 - 1; 3 - 2
miR-26a 2 2.1E-05 3 - 1; 1 - 4; 3 - 2; 2 - 4; 3 - 4
miR-126 2 9.80E-05 3 - 1; 2 - 4; 3 - 4
miR-21 2 5.82E-04 2 - 1; 3 - 1; 4 - 1; 3 - 4
miR-338-3p 2 0.003743 4 - 1; 2 - 3; 4 - 3
miR-29 2 0.010592 1 - 3; 2 - 3; 2 - 4
miR-1 3 8.15E-12 1 - 2; 1 - 3; 1 - 4
miR-570 3 7.84E-11 1 - 2; 1 - 3; 2 - 3; 4 - 2; 4 - 3
miR-144 3 2.44E-10 1 - 2; 1 - 3; 2 - 3; 4 - 2; 4 - 3
miR-1291 3 1.78E-08 1 - 2; 1 - 3; 1 - 4; 2 - 3; 4 - 2; 4 - 3
miR-330-5p 3 3.23E-08 1 - 2; 1 - 3; 4 - 2; 4 - 3
Let-7f 3 1.05E-06 1 - 2; 1 - 3; 3 - 2; 4 - 2; 4 - 3
miR-374a 3 3.58E-06 1 - 2; 1 - 3; 4 - 2; 4 - 3
miR-299-5p 3 4.69E-05 1 - 2; 1 - 3; 1 - 4; 4 - 3
miR-1248 3 5.61E-05 1 - 2; 1 - 3; 4 - 2; 4 - 3
miR-223 4 4.2E-16 1 - 4; 2 - 4; 3 - 4
miR-133b 4 9.32E-06 1 - 2; 1 - 3; 1 - 4; 2 - 4; 3 - 4
miR-148a 4 1E-05 1 - 4; 2 - 4; 3 - 4
miR-16 4 7.24E-04 1 - 3; 1 - 4; 2 - 3; 2 - 4
miR-106a 4 0.002195 1 - 3; 1 - 4; 2 - 3; 2 - 4
miR-26b 4 0.005422 1 - 2; 1 - 3; 1 - 4
miR-150 4 0.008776 1 - 4; 2 - 3; 2 - 4
miR-133a 4 0.025097 2 - 1; 2 - 3; 2 - 4
miR-937 5 2.82E-18 1 - 2; 1 - 3; 1 - 4; 2 - 3; 4 - 3
miR-206 5 2.47E-15 1 - 2; 1 - 3; 2 - 3; 4 - 3
miR-365 5 6.49E-14 1 - 2; 1 - 3; 1 - 4; 2 - 3; 2 - 4; 3 - 4
miR-346 5 4.9E-11 1 - 2; 1 - 3; 1 - 4; 2 - 3; 2 - 4; 4 - 3
miR-422 5 7.04E-08 1 - 3; 1 - 4; 2 - 3; 2 - 4
mir-125b 5 1.62E-07 1 - 3; 2 - 3; 4 - 3
miR-145 5 1.24E-05 1 - 3; 1 - 4; 2 - 3; 2 - 4; 3 - 4
miR-328 5 0.002629 1 - 2; 1 - 3; 1 - 4
Demographics of different clusters
The mean age of the subjects was 43.5, and this was not different among the clusters [Table 3]. There was
an overall female predominance in our population (65% female), which is consistent with the makeup of
our asthma clinic from which patients were recruited. The distribution of genders did not statistically differ
across the four clusters. However, Cluster 3 had a high percentage of females (75%), while Cluster 4 had a low
percentage (54%). Clusters 1 and 2 were comprised predominantly of white subjects, while there was more
racial diversity in Clusters 3 and 4. In Cluster 3, 45% of the subjects were black. There were only two Asian
subjects in our cohort (both in Cluster 4), and three Hispanic subjects (two in Cluster 3 and one in Cluster 4).
Obesity across clusters
Our cohort of asthmatics had a high rate of obesity, consisting of 44% with body mass index (BMI) > 30,
35% with BMI 25-30, and 21% with BMI < 25. Mean BMI in Cluster 3 was the highest at 35.1 (12), 31.8 (8.4) in
Cluster 4, 31.7 (7.6) in Cluster 1, and the lowest in Cluster 2 at 27.7 (5.4).