
Page 28 - Read Online
P. 28
Page 4 of 11 Zhang et al. J Transl Genet Genom 2018;2:18. I https://doi.org/10.20517/jtgg.2018.22
Table 1. Study demographics
Asthmatic subjects (n = 62)
Age (mean ± SD) 43.5 ± 14.6
Gender (number) Female (n = 40), Male (n = 22)
Race (W/B/A); Ethnicity (H) 1 n = 47 W, n = 13 B, n = 2 A; n = 3 H
BMI (mean ± SD) 31.5 ± 9.1
Asthma duration (mean ± SD) 22.3 ± 14.7
2
Daily ICS dose (mean ± SD) 570.5 ± 466.2
FVC (%, mean ± SD) 84.4 ± 17.7
FEV1 (%, mean ± SD) 69.5 ± 21.5
FEV1/FVC ratio (mean ± SD) 0.66 ± 0.13
FEV1% (mean ± SD) 69.5 ± 21.5
Blood eosinophil (cells/µL, mean ± SD) 3 343.5 ± 316.4
Total IgE (kIU/mL, mean ± SD) 4 522.2 ± 480.3
Number with aeroallergen sensitivity ( ≥ 1 positive test) 54 (87%)
1 2 3 4
W: White; B: Black; A: Asian; H: Hispanic; fluticasone equivalent; values were missing in 9 subjects; values were missing in 27 subjects.
BMI: body mass index; ICS: inhaled corticosteroid; FVC: forced vital capacity; FEV1: forced expiratory volume in 1 s
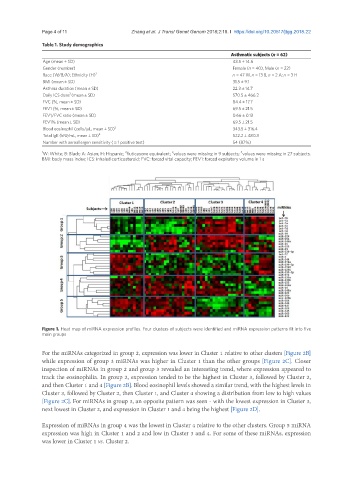
Figure 1. Heat map of miRNA expression profiles. Four clusters of subjects were identified and miRNA expression patterns fit into five
main groups
For the miRNAs categorized in group 2, expression was lower in Cluster 1 relative to other clusters [Figure 2B]
while expression of group 3 miRNAs was higher in Cluster 1 than the other groups [Figure 2C]. Closer
inspection of miRNAs in group 2 and group 3 revealed an interesting trend, where expression appeared to
track the eosinophilia. In group 2, expression tended to be the highest in Cluster 3, followed by Cluster 2,
and then Cluster 1 and 4 [Figure 2B]. Blood eosinophil levels showed a similar trend, with the highest levels in
Cluster 3, followed by Cluster 2, then Cluster 1, and Cluster 4 showing a distribution from low to high values
[Figure 2C]. For miRNAs in group 3, an opposite pattern was seen - with the lowest expression in Cluster 3,
next lowest in Cluster 2, and expression in Cluster 1 and 4 being the highest [Figure 2D].
Expression of miRNAs in group 4 was the lowest in Cluster 4 relative to the other clusters. Group 5 miRNA
expression was high in Cluster 1 and 2 and low in Cluster 3 and 4. For some of these miRNAs, expression
was lower in Cluster 1 vs. Cluster 2.