Page 30 - Read Online
P. 30

Page 6 of 11                                                   Zhang et al. J Transl Genet Genom 2018;2:18. I  https://doi.org/10.20517/jtgg.2018.22

                              A            miR-98            B             miR-126


                                                                28

                             Log 20                             26
                                                             Log
                             cop
                                                             cop  24
                             y  15
                                                             y
                             nu                                 22
                                10                           nu
                                                                20

                                     CL1   CL2  CL3   CL4            CL1  CL2   CL3   CL4
                              C                                 D
                                        Blood eosinophil per cluster      miR-570-3p


                                 1500                         Log  20
                               Eosinophils (cells/ml)  1000   cop  15


                                                              y
                                 500
                                                              nu
                                                                 10
                                   0                             5
                                       CL1   CL2   CL3   CL4          CL1  CL2  CL3   CL4
                                           Group 4                          Group 5

                                          miR-148a                       miR-365
                              E                             F


                                24
                                22
                            Log                            Log  20
                            cop  20                        cop
                                                                15
                            y   18                         y
                            nu                             nu
                                16                              10
                                14

                                     CL1  CL2   CL3  CL4             CL1  CL2  CL3   CL4
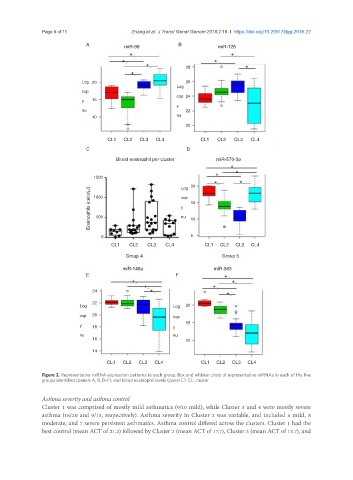
               Figure 2. Representative miRNA expression patterns in each group. Box and whisker plots of representative miRNAs in each of the five
               groups identified (panels A, B, D-F), and blood eosinophil levels (panel C). CL: cluster


               Asthma severity and asthma control
               Cluster 1 was comprised of mostly mild asthmatics (9/10 mild), while Cluster 3 and 4 were mostly severe
               asthma (18/20 and 9/13, respectively). Asthma severity in Cluster 2 was variable, and included 5 mild, 8
               moderate, and 7 severe persistent asthmatics. Asthma control differed across the clusters. Cluster 1 had the
               best control (mean ACT of 21.2) followed by Cluster 2 (mean ACT of 17.7), Cluster 3 (mean ACT of 13.7), and
   25   26   27   28   29   30   31   32   33   34   35