


Page 239 - Read Online
P. 239
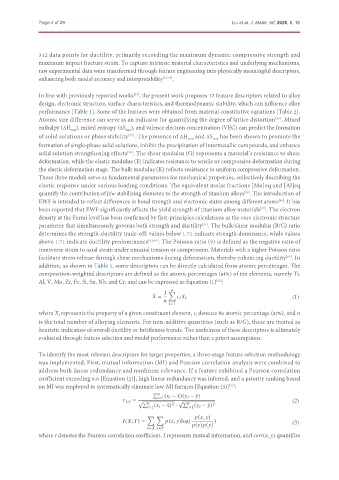
Page 4 of 29                                                       Liu et al. J. Mater. Inf. 2026, 6, 18


               312 data points for ductility, primarily recording the maximum dynamic compressive strength and
               maximum impact fracture strain. To capture intrinsic material characteristics and underlying mechanisms,
               raw experimental data were transformed through feature engineering into physically meaningful descriptors,
               enhancing both model accuracy and interpretability [52-54] .


               In line with previously reported works , the present work proposes 17 feature descriptors related to alloy
                                                [55]
               design, electronic structure, surface characteristics, and thermodynamic stability, which can influence alloy
               performance [Table 1]. Some of the features were obtained from material constitutive equations [Table 2].
               Atomic size difference can serve as an indicator for quantifying the degree of lattice distortion . Mixed
                                                                                                  [56]
               enthalpy (ΔH ), mixed entropy (ΔS ), and valence electron concentration (VEC) can predict the formation
                                             mix
                          mix
               of solid solutions or phase stability . The presence of ΔH  and ΔS  has been shown to promote the
                                              [57]
                                                                   mix
                                                                            mix
               formation of single-phase solid solutions, inhibit the precipitation of intermetallic compounds, and enhance
               solid solution strengthening effects . The shear modulus (G) represents a material’s resistance to shear
                                              [58]
               deformation, while the elastic modulus (E) indicates resistance to tensile or compressive deformation during
               the elastic deformation stage. The bulk modulus (K) reflects resistance to uniform compressive deformation.
               These three moduli serve as fundamental parameters for mechanical properties, collectively describing the
               elastic response under various loading conditions. The equivalent molar fractions [Mo]eq and [Al]eq
               quantify the contribution of β/α-stabilizing elements to the strength of titanium alloys . The introduction of
                                                                                       [59]
               EWF is intended to reflect differences in bond strength and electronic states among different atoms . It has
                                                                                                   [60]
               been reported that EWF significantly affects the yield strength of titanium alloy materials . The electron
                                                                                            [37]
               density at the Fermi level has been confirmed by first-principles calculations as the core electronic structure
               parameter that simultaneously governs both strength and ductility . The bulk/shear modulus (B/G) ratio
                                                                        [61]
               determines the strength-ductility trade-off: values below 1.71 indicate strength dominance, while values
               above 1.71 indicate ductility predominance [62,63] . The Poisson ratio (v) is defined as the negative ratio of
               transverse strain to axial strain under uniaxial tension or compression. Materials with a higher Poisson ratio
               facilitate stress release through shear mechanisms during deformation, thereby enhancing ductility . In
                                                                                                     [64]
               addition, as shown in Table 1, some descriptors can be directly calculated from atomic percentages. The
               composition-weighted descriptors are defined as the atomic percentages (at%) of ten elements, namely Ti,
               Al, V, Mo, Zr, Fe, Si, Sn, Nb, and Cr, and can be expressed as Equation (1) :
                                                                             [65]
                                                           1     Õ
                                                       ¯
                                                          =                                             (1)

                                                              =1
               where X represents the property of a given constituent element, c denotes its atomic percentage (at%), and n
                                                                      i
                      i
               is the total number of alloying elements. For non-additive quantities (such as B/G), these are treated as
               heuristic indicators of overall ductility or brittleness trends. The usefulness of these descriptors is ultimately
               evaluated through feature selection and model performance rather than a priori assumptions.

               To identify the most relevant descriptors for target properties, a three-stage feature selection methodology
               was implemented. First, mutual information (MI) and Pearson correlation analysis were combined to
               address both linear redundancy and nonlinear relevance. If a feature exhibited a Pearson correlation
               coefficient exceeding 0.8 [Equation (2)], high linear redundancy was inferred, and a priority ranking based
               on MI was employed to systematically eliminate low-MI features [Equation (3)] :
                                                                                  [55]
                                                       Í
                                                          =1 (      − ¯   )(      − ¯   )
                                                    = p Í       p Í                                     (2)
                                                             2              2
                                                       =1  (      − ¯   ) ·    =1  (      − ¯   )
                                                     Õ Õ               (  ,   )
                                              (  ;  ) =      (  ,   )log(   )                           (3)
                                                                      (  )  (  )
                                                       ∈     ∈
               where r denotes the Pearson correlation coefficient, I represents mutual information, and corr(x, y) quantifies

