


Page 228 - Read Online
P. 228
Page 6 of 13                                                      Yuan et al. J. Mater. Inf. 2026, 6, 17


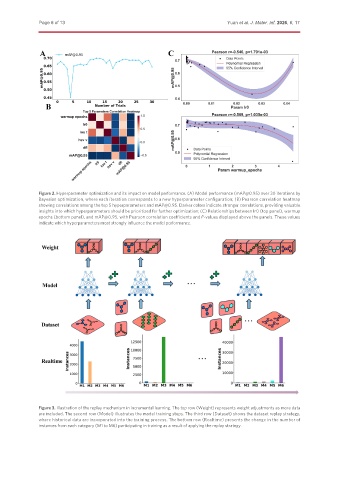
               Figure 2. Hyperparameter optimization and its impact on model performance. (A) Model performance (mAP@0.95) over 30 iterations by
               Bayesian optimization, where each iteration corresponds to a new hyperparameter configuration; (B) Pearson correlation heatmap
               showing correlations among the top 5 hyperparameters and mAP@0.95. Darker colors indicate stronger correlations, providing valuable
               insights into which hyperparameters should be prioritized for further optimization; (C) Relationships between Ir0 (top panel), warmup
               epochs (bottom panel), and mAP@0.95, with Pearson correlation coefficients and P-values displayed above the panels. These values
               indicate which hyperparameters most strongly influence the model performance.


               Figure 3. Illustration of the replay mechanism in incremental learning. The top row (Weight) represents weight adjustments as more data
               are included. The second row (Model) illustrates the model training steps. The third row (Dataset) shows the dataset replay strategy,
               where historical data are incorporated into the training process. The bottom row (Realtime) presents the change in the number of
               instances from each category (M1 to M6) participating in training as a result of applying the replay strategy.

