


Page 229 - Read Online
P. 229
Yuan et al. J. Mater. Inf. 2026, 6, 17                                            Page 7 of 13


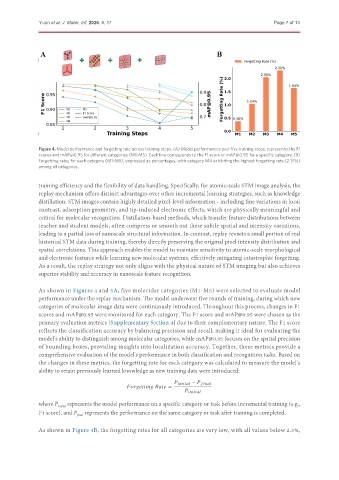
               Figure 4. Model performance and forgetting rate across training steps. (A) Model performances over five training steps, represented by F1
               scores and mAP@0.95 for different categories (M1-M5). Each line corresponds to the F1 score or mAP@0.95 for a specific category; (B)
               Forgetting rates for each category (M1-M5), expressed as percentages, with category M4 exhibiting the highest forgetting rate (2.31%)
               among all categories.


               training efficiency and the flexibility of data handling. Specifically, for atomic-scale STM image analysis, the
               replay mechanism offers distinct advantages over other incremental learning strategies, such as knowledge
               distillation. STM images contain highly detailed pixel-level information - including fine variations in local
               contrast, adsorption geometry, and tip-induced electronic effects, which are physically meaningful and
               critical for molecular recognition. Distillation-based methods, which transfer feature distributions between
               teacher and student models, often compress or smooth out these subtle spatial and intensity variations,
               leading to a partial loss of nanoscale structural information. In contrast, replay revisits a small portion of real
               historical STM data during training, thereby directly preserving the original pixel intensity distribution and
               spatial correlations. This approach enables the model to maintain sensitivity to atomic-scale morphological
               and electronic features while learning new molecular systems, effectively mitigating catastrophic forgetting.
               As a result, the replay strategy not only aligns with the physical nature of STM imaging but also achieves
               superior stability and accuracy in nanoscale feature recognition.


               As shown in Figures 4 and 5A, five molecular categories (M1-M5) were selected to evaluate model
               performance under the replay mechanism. The model underwent five rounds of training, during which new
               categories of molecular image data were continuously introduced. Throughout this process, changes in F1
               scores and mAP@0.95 were monitored for each category. The F1 score and mAP@0.95 were chosen as the
               primary evaluation metrics [Supplementary Section 4] due to their complementary nature. The F1 score
               reflects the classification accuracy by balancing precision and recall, making it ideal for evaluating the
               model’s ability to distinguish among molecular categories, while mAP@0.95 focuses on the spatial precision
               of bounding boxes, providing insights into localization accuracy. Together, these metrics provide a
               comprehensive evaluation of the model’s performance in both classification and recognition tasks. Based on
               the changes in these metrics, the forgetting rate for each category was calculated to measure the model’s
               ability to retain previously learned knowledge as new training data were introduced:


                                                                                −
                                                                            =

               where P initial  represents the model performance on a specific category or task before incremental training (e.g.,
               F1 score), and P  represents the performance on the same category or task after training is completed.
                            final

               As shown in Figure 4B, the forgetting rates for all categories are very low, with all values below 2.5%,

