


Page 20 - Read Online
P. 20
Zhang et al. J Mater Inf 2024;4:34  https://dx.doi.org/10.20517/jmi.2024.64     Page 13 of 28


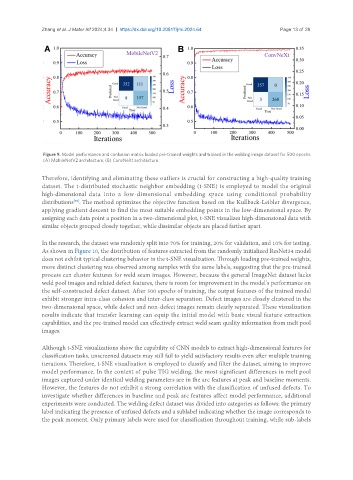
                Figure 9. Model performance and confusion matrix loaded pre-trained weights and trained in the welding image dataset for 500 epochs.
                (A) MobileNetV2 architecture; (B) ConvNeXt architecture.


               Therefore, identifying and eliminating these outliers is crucial for constructing a high-quality training
               dataset. The t-distributed stochastic neighbor embedding (t-SNE) is employed to model the original
               high-dimensional  data  into  a  low-dimensional  embedding  space  using  conditional  probability
               distributions . The method optimizes the objective function based on the Kullback-Leibler divergence,
                          [92]
               applying gradient descent to find the most suitable embedding points in the low-dimensional space. By
               assigning each data point a position in a two-dimensional plot, t-SNE visualizes high-dimensional data with
               similar objects grouped closely together, while dissimilar objects are placed farther apart.

               In the research, the dataset was randomly split into 70% for training, 20% for validation, and 10% for testing.
               As shown in Figure 10, the distribution of features extracted from the randomly initialized ResNet34 model
               does not exhibit typical clustering behavior in the t-SNE visualization. Through loading pre-trained weights,
               more distinct clustering was observed among samples with the same labels, suggesting that the pre-trained
               process can cluster features for weld seam images. However, because the general ImageNet dataset lacks
               weld pool images and related defect features, there is room for improvement in the model’s performance on
               the self-constructed defect dataset. After 500 epochs of training, the output features of the trained model
               exhibit stronger intra-class cohesion and inter-class separation. Defect images are closely clustered in the
               two-dimensional space, while defect and non-defect images remain clearly separated. These visualization
               results indicate that transfer learning can equip the initial model with basic visual feature extraction
               capabilities, and the pre-trained model can effectively extract weld seam quality information from melt pool
               images.

               Although t-SNE visualizations show the capability of CNN models to extract high-dimensional features for
               classification tasks, unscreened datasets may still fail to yield satisfactory results even after multiple training
               iterations. Therefore, t-SNE visualization is employed to classify and filter the dataset, aiming to improve
               model performance. In the context of pulse TIG welding, the most significant differences in melt pool
               images captured under identical welding parameters are in the arc features at peak and baseline moments.
               However, the features do not exhibit a strong correlation with the classification of unfused defects. To
               investigate whether differences in baseline and peak arc features affect model performance, additional
               experiments were conducted. The welding defect dataset was divided into categories as follows: the primary
               label indicating the presence of unfused defects and a sublabel indicating whether the image corresponds to
               the peak moment. Only primary labels were used for classification throughout training, while sub-labels

