
Page 14 - Read Online
P. 14
Page 8 of 11 Han et al. J Mater Inf 2023;3:24 https://dx.doi.org/10.20517/jmi.2023.32
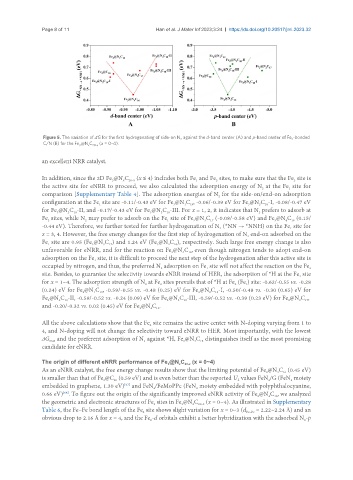
Figure 5. The variation of ΔG for the first hydrogenating of side-on N against the d-band center (A) and p-band center of Fe -bonded
2
2
C/N (B) for the Fe @N C 20-x (x = 0~4).
x
3
an excellent NRR catalyst.
In addition, since the 2D Fe @N C (x ≤ 4) includes both Fe and Fe sites, to make sure that the Fe site is
2
2
3
20-x
x
1
the active site for eNRR to proceed, we also calculated the adsorption energy of N at the Fe site for
2
1
comparison [Supplementary Table 4]. The adsorption energies of N for the side-on/end-on adsorption
2
configuration at the Fe site are -0.11/-0.43 eV for Fe @N C , -0.06/-0.39 eV for Fe @N C -I, -0.08/-0.47 eV
3
1
3
18
19
1
2
for Fe @N C -II, and -0.17/-0.43 eV for Fe @N C -III. For x = 1, 2, it indicates that N prefers to adsorb at
2
18
3
3
2
18
2
Fe sites, while N may prefer to adsorb on the Fe site of Fe @N C (-0.08/-0.58 eV) and Fe @N C (0.15/
17
2
3
4
2
3
1
3
16
-0.44 eV). Therefore, we further tested for further hydrogenation of N (*NN → *NNH) on the Fe site for
2
1
x = 3, 4. However, the free energy changes for the first step of hydrogenation of N end-on adsorbed on the
2
Fe site are 0.95 (Fe @N C ) and 1.24 eV (Fe @N C ), respectively. Such large free energy change is also
16
4
3
1
3
17
3
unfavorable for eNRR, and for the reaction on Fe @N C , even though nitrogen tends to adopt end-on
3
16
4
adsorption on the Fe site, it is difficult to proceed the next step of the hydrogenation after this active site is
1
occupied by nitrogen, and thus, the preferred N adsorption on Fe site will not affect the reaction on the Fe
2
2
1
site. Besides, to guarantee the selectivity towards eNRR instead of HER, the adsorption of *H at the Fe site
1
for x = 1~4. The adsorption strength of N at Fe sites prevails that of *H at Fe (Fe ) site: -0.62/-0.55 vs. -0.28
1
2
2
2
(0.24) eV for Fe @N C , -0.59/-0.55 vs. -0.48 (0.25) eV for Fe @N C -I, -0.50/-0.48 vs. -0.30 (0.65) eV for
1
19
18
3
3
2
Fe @N C -II, -0.59/-0.52 vs. -0.24 (0.09) eV for Fe @N C -III, -0.59/-0.52 vs. -0.39 (0.23 eV) for Fe @N C ,
3
18
3
3
2 18
3
2
17
and -0.20/-0.32 vs. 0.02 (0.45) eV for Fe @N C .
4 16
3
All the above calculations show that the Fe site remains the active center with N-doping varying from 1 to
2
4, and N-doping will not change the selectivity toward eNRR to HER. Most importantly, with the lowest
ΔG and the preferent adsorption of N against *H, Fe @N C distinguishes itself as the most promising
4
max
2
16
3
candidate for eNRR.
The origin of different eNRR performance of Fe @N C (x = 0~4)
3 x 20-x
As an eNRR catalyst, the free energy change results show that the limiting potential of Fe @N C (0.45 eV)
4
16
3
is smaller than that of Fe @C (0.59 eV) and is even better than the reported U values FeN /G (FeN moiety
4
20
4
3
L
embedded in graphene, 1.30 eV) and FeN /FeMoPPc (FeN moiety embedded with polyphthalocyanine,
[63]
4
4
0.66 eV) . To figure out the origin of the significantly improved eNRR activity of Fe @N C , we analyzed
[64]
16
4
3
the geometric and electronic structures of Fe sites in Fe @N C (x = 0~4). As illustrated in Supplementary
20-x
3
x
2
Table 6, the Fe−Fe bond length of the Fe site shows slight variation for x = 0~3 (d Fe−Fe = 2.22~2.24 Å) and an
2
obvious drop to 2.16 Å for x = 4, and the Fe -d orbitals exhibit a better hybridization with the adsorbed N -p
2
2