Page 10 - Read Online
P. 10

Page 4 of 11                           Han et al. J Mater Inf 2023;3:24  https://dx.doi.org/10.20517/jmi.2023.32


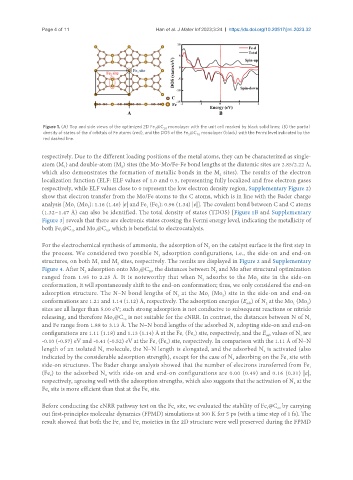
                Figure 1. (A) Top and side views of the optimized 2D Fe @C  monolayer with the unit cell marked by black solid lines; (B) the partial
                                                     3
                                                        20
                density of states of the d orbitals of Fe atoms (red), and the DOS of the Fe @C  monolayer (black) with the Fermi level indicated by the
                                                                   20
                                                                3
                red dashed line.
               respectively. Due to the different loading positions of the metal atoms, they can be characterized as single-
               atom (M ) and double-atom (M ) sites (the Mo-Mo/Fe-Fe bond lengths at the diatomic sites are 2.85/2.22 Å,
                       1
                                          2
               which also demonstrates the formation of metallic bonds in the M  sites). The results of the electron
                                                                           2
               localization function (ELF: ELF values of 1.0 and 0.5, representing fully localized and free electron gases
               respectively, while ELF values close to 0 represent the low electron density region, Supplementary Figure 2)
               show that electron transfer from the Mo/Fe atoms to the C atoms, which is in line with the Bader charge
               analysis [Mo  (Mo ): 1.16 (1.46) |e| and Fe  (Fe ): 0.96 (1.34) |e|]. The covalent bond between C and C atoms
                          1
                                                  1
                                                      2
                               2
               (1.32~1.47 Å) can also be identified. The total density of states (TDOS) [Figure 1B and Supplementary
               Figure 3] reveals that there are electronic states crossing the Fermi energy level, indicating the metallicity of
               both Fe @C  and Mo @C , which is beneficial to electrocatalysis.
                      3
                         20
                                     20
                                 3
               For the electrochemical synthesis of ammonia, the adsorption of N  on the catalyst surface is the first step in
                                                                       2
               the process. We considered two possible N  adsorption configurations, i.e., the side-on and end-on
                                                      2
               structures, on both M  and M  sites, respectively. The results are displayed in Figure 2 and Supplementary
                                  1
                                         2
               Figure 4. After N  adsorption onto Mo @C , the distances between N  and Mo after structural optimization
                              2
                                                   20
                                                3
                                                                          2
               ranged from 1.95 to 2.25  Å. It is noteworthy that when N  adsorbs to the Mo  site in the side-on
                                                                     2
                                                                                        2
               conformation, it will spontaneously shift to the end-on conformation; thus, we only considered the end-on
               adsorption structure. The N−N bond lengths of N  at the Mo  (Mo ) site in the side-on and end-on
                                                             2
                                                                       1
                                                                            2
               conformations are 1.21 and 1.14 (1.12) Å, respectively. The adsorption energies (E ) of N  at the Mo  (Mo )
                                                                                    ads
                                                                                           2
                                                                                                         2
                                                                                                    1
               sites are all larger than 5.00 eV; such strong adsorption is not conducive to subsequent reactions or nitride
               releasing, and therefore Mo @C  is not suitable for the eNRR. In contrast, the distances between N of N
                                       3
                                                                                                         2
                                           20
               and Fe range from 1.88 to 3.13 Å. The N−N bond lengths of the adsorbed N  adopting side-on and end-on
                                                                                2
               configurations are 1.11 (1.18) and 1.13 (1.14) Å at the Fe  (Fe ) site, respectively, and the E  values of N  are
                                                                  2
                                                              1
                                                                                                      2
                                                                                           ads
               -0.10 (-0.57) eV and -0.41 (-0.52) eV at the Fe  (Fe ) site, respectively. In comparison with the 1.11 Å of N−N
                                                     1
                                                         2
               length of an isolated N  molecule, the N−N length is elongated, and the adsorbed N  is activated (also
                                                                                          2
                                    2
               indicated by the considerable adsorption strength), except for the case of N  adsorbing on the Fe  site with
                                                                               2
                                                                                                  1
               side-on structures. The Bader charge analysis showed that the number of electrons transferred from Fe
                                                                                                         1
               (Fe ) to the adsorbed N  with side-on and end-on configurations are 0.00 (0.49) and 0.16 (0.31) |e|,
                  2
                                    2
               respectively, agreeing well with the adsorption strengths, which also suggests that the activation of N  at the
                                                                                                    2
               Fe  site is more efficient than that at the Fe  site.
                                                   1
                 2
               Before conducting the eNRR pathway test on the Fe  site, we evaluated the stability of Fe @C  by carrying
                                                            2
                                                                                           3
                                                                                              20
               out first-principles molecular dynamics (FPMD) simulations at 300 K for 5 ps (with a time step of 1 fs). The
               result showed that both the Fe  and Fe  moieties in the 2D structure were well preserved during the FPMD
                                                2
                                         1
   5   6   7   8   9   10   11   12   13   14   15