Page 13 - Read Online
P. 13

Han et al. J Mater Inf 2023;3:24  https://dx.doi.org/10.20517/jmi.2023.32        Page 7 of 11


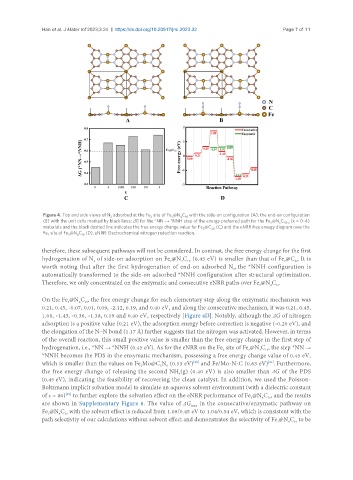
                Figure 4. Top and side views of N  adsorbed at the Fe  site of Fe @N C  with the side-on configuration (A); the end-on configuration
                                      2             2      3  4  16
                (B) with the unit cells marked by black lines; ΔG for the *NN → *NNH step of the energy preferred path for the Fe @N C   (x = 0~4)
                                                                                            3  x  20-x
                materials and the black dashed line indicates the free energy change value for Fe @C  (C) and the eNRR free energy diagram over the
                                                                     3
                                                                        20
                Fe  site of Fe @N C  (D). eNRR: Electrochemical nitrogen reduction reaction.
                           4
                             16
                 2
                        3
               therefore, these subsequent pathways will not be considered. In contrast, the free energy change for the first
               hydrogenation of N  of side-on adsorption on Fe @N C  (0.45 eV) is smaller than that of Fe @C . It is
                                 2
                                                          3
                                                              4
                                                                16
                                                                                                 3
                                                                                                    20
               worth noting that after the first hydrogenation of end-on adsorbed N , the *NNH configuration is
                                                                                2
               automatically transformed to the side-on adsorbed *NNH configuration after structural optimization.
               Therefore, we only concentrated on the enzymatic and consecutive eNRR paths over Fe @N C .
                                                                                        3
                                                                                            4 16
               On the Fe @N C , the free energy change for each elementary step along the enzymatic mechanism was
                        3
                              16
                            4
               0.21, 0.45, -0.07, 0.01, 0.09, -2.12, 0.19, and 0.40 eV, and along the consecutive mechanism, it was 0.21, 0.45,
               1.08, -1.43, -0.36, -1.38, 0.19 and 0.40 eV, respectively [Figure 4D]. Notably, although the ΔG of nitrogen
               adsorption is a positive value (0.21 eV), the adsorption energy before correction is negative (-0.20 eV), and
               the elongation of the N−N bond (1.17 Å) further suggests that the nitrogen was activated. However, in terms
               of the overall reaction, this small positive value is smaller than the free energy change in the first step of
               hydrogenation, i.e., *NN → *NNH (0.45 eV). As for the eNRR on the Fe  site of Fe @N C , the step *NN →
                                                                            2
                                                                                          16
                                                                                        4
                                                                                     3
               *NNH becomes the PDS in the enzymatic mechanism, possessing a free energy change value of 0.45 eV,
               which is smaller than the values on Fe Mo@C N  (0.53 eV)  and Fe/Mo-N-C (0.63 eV) . Furthermore,
                                                                                           [61]
                                                                  [60]
                                                       6
                                                2
                                                         6
               the free energy change of releasing the second NH (g) (0.40 eV) is also smaller than ΔG of the PDS
                                                             3
               (0.45 eV), indicating the feasibility of recovering the clean catalyst. In addition, we used the Poisson-
               Boltzmann implicit solvation model to simulate an aqueous solvent environment (with a dielectric constant
               of ε = 80)  to further explore the solvation effect on the eNRR performance of Fe @N C , and the results
                       [62]
                                                                                           16
                                                                                         4
                                                                                      3
               are shown in Supplementary Figure 8. The value of ΔG  in the consecutive/enzymatic pathway on
                                                                 max
               Fe @N C  with the solvent effect is reduced from 1.08/0.45 eV to 1.04/0.34 eV, which is consistent with the
                     4 16
                 3
               path selectivity of our calculations without solvent effect and demonstrates the selectivity of Fe @N C  to be
                                                                                                  4 16
                                                                                              3
   8   9   10   11   12   13   14   15   16   17   18