
Page 46 - Read Online
P. 46
Park et al. J Mater Inf 2023;3:5 https://dx.doi.org/10.20517/jmi.2022.37 Page 9 of 25
Figure 4. (A) A schematic diagram of the experimental apparatus and (B) a droplet image of sample I at 1,400 °C.
-1
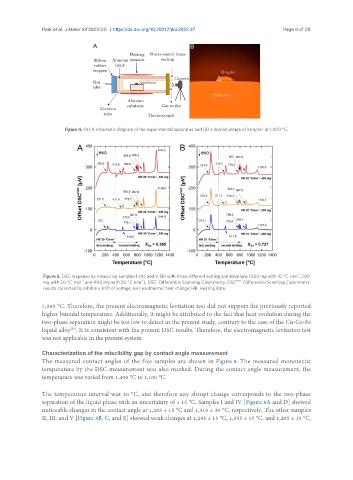
Figure 5. DSC response by measuring samples I (A) and V (B) with three different setting combinations (200 mg with 10 °C min , 200
-1
-1
mg with 20 °C min , and 400 mg with 20 °C min ). DSC: Differential Scanning Calorimetry; DSC corr : Differential Scanning Calorimetry
results corrected by arbitrary shift of voltage; exo: exothermic heat change; HR: Heating Rate.
1,385 °C. Therefore, the present electromagnetic levitation test did not support the previously reported
higher binodal temperature. Additionally, it might be attributed to the fact that heat evolution during the
two-phase separation might be too low to detect in the present study, contrary to the case of the Cu-Co-Fe
[50]
liquid alloy . It is consistent with the present DSC results. Therefore, the electromagnetic levitation test
was not applicable in the present system.
Characterization of the miscibility gap by contact angle measurement
The measured contact angles of the five samples are shown in Figure 8. The measured monotectic
temperature by the DSC measurement was also marked. During the contact angle measurement, the
temperature was varied from 1,400 °C to 1,100 °C.
The temperature interval was 30 °C, and therefore any abrupt change corresponds to the two-phase
separation of the liquid phase with an uncertainty of ± 15 °C. Samples I and IV [Figure 8A and D] showed
noticeable changes in the contact angle at 1,265 ± 15 °C and 1,310 ± 30 °C, respectively. The other samples
II, III, and V [Figure 8B, C, and E] showed weak changes at 1,295 ± 15 °C, 1,355 ± 15 °C, and 1,295 ± 15 °C,