
Page 47 - Read Online
P. 47
Page 10 of 25 Park et al. J Mater Inf 2023;3:5 https://dx.doi.org/10.20517/jmi.2022.37
-1
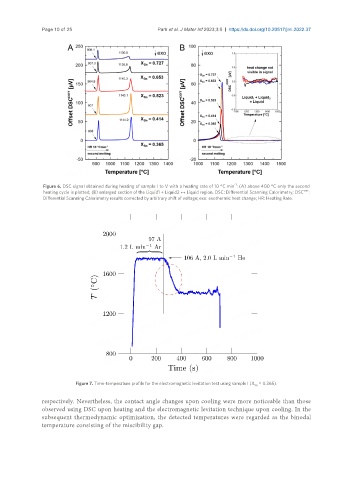
Figure 6. DSC signal obtained during heating of sample I to V with a heating rate of 10 °C min : (A) above 400 °C only the second
heating cycle is plotted; (B) enlarged section of the Liquid1 + Liquid2 ↔ Liquid region. DSC: Differential Scanning Calorimetry; DSC corr :
Differential Scanning Calorimetry results corrected by arbitrary shift of voltage; exo: exothermic heat change; HR: Heating Rate.
Figure 7. Time-temperature profile for the electromagnetic levitation test using sample I (X = 0.365).
Sn
respectively. Nevertheless, the contact angle changes upon cooling were more noticeable than those
observed using DSC upon heating and the electromagnetic levitation technique upon cooling. In the
subsequent thermodynamic optimization, the detected temperatures were regarded as the binodal
temperature consisting of the miscibility gap.