
Page 41 - Read Online
P. 41
Page 4 of 25 Park et al. J Mater Inf 2023;3:5 https://dx.doi.org/10.20517/jmi.2022.37
Table 1. Crystallographic data of stable phase in the Fe-Sn system [27]
Phase Pearson symbol Space group Strukturbericht Prototype
Liquid - - - -
fcc cF4 Fm m A1 Cu
bcc cI2 Im m A2 W
bct-Sn tI4 I4 /amd A5 βSn
1
FeSn hP6 P6/mmm B35 CoSn
FeSn 2 tI12 I4/mcm C16 Al Cu
2
Fe Sn hR10 R m - -
3 2
Fe Sn 3 hP6 P6 /mmc B8 2 Ni In
2
3
5
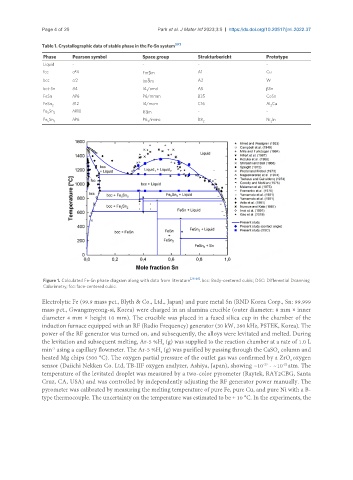
Figure 1. Calculated Fe-Sn phase diagram along with data from literature [28-46] . bcc: Body-centered cubic; DSC: Differential Dcanning
Calorimetry; fcc: face-centered cubic.
Electrolytic Fe (99.9 mass pct., Blyth & Co., Ltd., Japan) and pure metal Sn (RND Korea Corp., Sn: 99.999
mass pct., Gwangmyeong-si, Korea) were charged in an alumina crucible (outer diameter: 8 mm × inner
diameter 4 mm × height 10 mm). The crucible was placed in a fused silica cup in the chamber of the
induction furnace equipped with an RF (Radio Frequency) generator (30 kW, 260 kHz, PSTEK, Korea). The
power of the RF generator was turned on, and subsequently, the alloys were levitated and melted. During
the levitation and subsequent melting, Ar-5 %H (g) was supplied to the reaction chamber at a rate of 1.0 L
2
-1
min using a capillary flowmeter. The Ar-5 %H (g) was purified by passing through the CaSO column and
4
2
heated Mg chips (500 °C). The oxygen partial pressure of the outlet gas was confirmed by a ZrO oxygen
2
-22
-23
sensor (Daiichi Nekken Co. Ltd, TB-IIF oxygen analyzer, Ashiya, Japan), showing ~10 - ~10 atm. The
temperature of the levitated droplet was measured by a two-color pyrometer (Raytek, RAY2CBG, Santa
Cruz, CA, USA) and was controlled by independently adjusting the RF generator power manually. The
pyrometer was calibrated by measuring the melting temperature of pure Fe, pure Cu, and pure Ni with a B-
type thermocouple. The uncertainty on the temperature was estimated to be ± 10 °C. In the experiments, the