
Page 56 - Read Online
P. 56
Page 8 of 12 Liu et al. J Mater Inf 2022;2:20 https://dx.doi.org/10.20517/jmi.2022.29
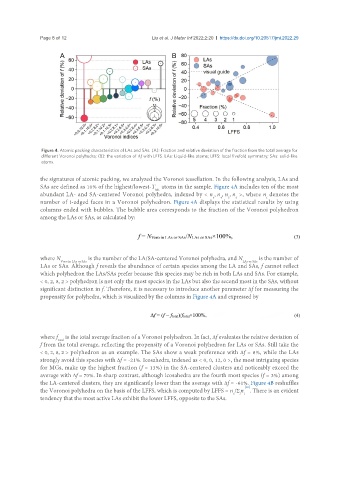
Figure 4. Atomic packing characteristics of LAs and SAs. (A): Fraction and relative deviation of the fraction from the total average for
different Voronoi polyhedra; (B): the variation of Δf with LFFS. LAs: Liquid-like atoms; LFFS: local fivefold symmetry; SAs: solid-like
atoms.
the signatures of atomic packing, we analyzed the Voronoi tessellation. In the following analysis, LAs and
SAs are defined as 10% of the highest/lowest-T atoms in the sample. Figure 4A includes ten of the most
ML
abundant LA- and SA-centered Voronoi polyhedra, indexed by < n , n , n , n >, where n denotes the
3 4 5 6 i
number of i-edged faces in a Voronoi polyhedron. Figure 4A displays the statistical results by using
columns ended with bubbles. The bubble area corresponds to the fraction of the Voronoi polyhedron
among the LAs or SAs, as calculated by:
where N is the number of the LA/SA-centered Voronoi polyhedra, and N is the number of
Voro in LAs or SAs LAs or SAs
LAs or SAs. Although f reveals the abundance of certain species among the LA and SAs, f cannot reflect
which polyhedron the LAs/SAs prefer because this species may be rich in both LAs and SAs. For example,
< 0, 2, 8, 2 > polyhedron is not only the most species in the LAs but also the second most in the SAs, without
significant distinction in f. Therefore, it is necessary to introduce another parameter Δf for measuring the
propensity for polyhedra, which is visualized by the columns in Figure 4A and expressed by
where f is the total average fraction of a Voronoi polyhedron. In fact, Δf evaluates the relative deviation of
total
f from the total average, reflecting the propensity of a Voronoi polyhedron for LAs or SAs. Still take the
< 0, 2, 8, 2 > polyhedron as an example. The SAs show a weak preference with Δf = 8%, while the LAs
strongly avoid this species with Δf = -21%. Icosahedra, indexed as < 0, 0, 12, 0 >, the most intriguing species
for MGs, make up the highest fraction (f = 13%) in the SA-centered clusters and noticeably exceed the
average with Δf = 70%. In sharp contrast, although icosahedra are the fourth most species (f = 3%) among
the LA-centered clusters, they are significantly lower than the average with Δf = -61%. Figure 4B reshuffles
[12]
the Voronoi polyhedra on the basis of the LFFS, which is computed by LFFS = n /Σn . There is an evident
5 i i
tendency that the most active LAs exhibit the lower LFFS, opposite to the SAs.