
Page 277 - Read Online
P. 277
Page 6 of 10 Finzel et al. J Cancer Metastasis Treat 2018;4:21 I http://dx.doi.org/10.20517/2394-4722.2018.10
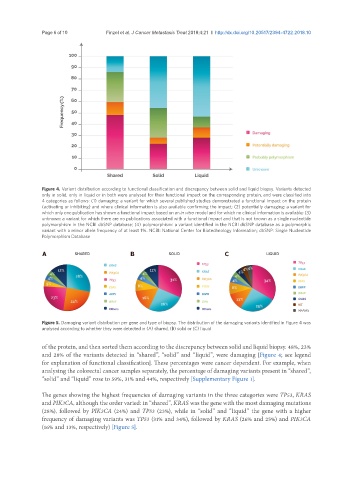
Figure 4. Variant distribution according to functional classification and discrepancy between solid and liquid biopsy. Variants detected
only in solid, only in liquid or in both were analysed for their functional impact on the corresponding protein, and were classified into
4 categories as follows: (1) damaging: a variant for which several published studies demonstrated a functional impact on the protein
(activating or inhibiting) and where clinical information is also available confirming the impact; (2) potentially damaging: a variant for
which only one publication has shown a functional impact based on an in vitro model and for which no clinical information is available; (3)
unknown: a variant for which there are no publications associated with a functional impact and that is not known as a single nucleotide
polymorphism in the NCBI dbSNP database; (4) polymorphism: a variant identified in the NCBI dbSNP database as a polymorphic
variant with a minor allele frequency of at least 1%. NCBI: National Center for Biotechnology Information; dbSNP: Single Nucleotide
Polymorphism Database
A B C
Figure 5. Damaging variant distribution per gene and type of biopsy. The distribution of the damaging variants identified in Figure 4 was
analysed according to whether they were detected in (A) shared, (B) solid or (C) liquid
of the protein, and then sorted them according to the discrepancy between solid and liquid biopsy. 48%, 23%
and 28% of the variants detected in “shared”, “solid” and “liquid”, were damaging [Figure 4; see legend
for explanation of functional classification]. These percentages were cancer dependent. For example, when
analysing the colorectal cancer samples separately, the percentage of damaging variants present in “shared”,
“solid” and “liquid” rose to 59%, 31% and 44%, respectively [Supplementary Figure 1].
The genes showing the highest frequencies of damaging variants in the three categories were TP53, KRAS
and PIK3CA, although the order varied: in “shared”, KRAS was the gene with the most damaging mutations
(28%), followed by PIK3CA (24%) and TP53 (23%), while in “solid” and “liquid” the gene with a higher
frequency of damaging variants was TP53 (31% and 34%), followed by KRAS (26% and 25%) and PIK3CA
(16% and 13%, respectively) [Figure 5].