
Page 93 - Read Online
P. 93
Saleh et al. Improvement of prostate cancer detection
6.5 years (P > 0.05) as represented in Table 1. prediagnostic serum concentrations of tPSA, fPSA,
IGF-I, IGFBP-3, and CgA and ratios thereof, for 72
Serum tPSA levels were significantly higher in the PCa patients with PCa and 126 control individuals. The AUC
group, 34.3 ± 21.1 ng/mL, as compared to the control for tPSA, IGF-I, IGFBP-3, and CgA was 0.83, 0.58,
group, 2.8 ± 1.9 ng/mL (P < 0.005) [Table 1], and 0.55 and 0.56 respectively. The AUC for f/tPSA, IGF-
the study showed significant differentiation between 1/tPSA, IGFP-3/tPSA and CgA/tPSA was 0.76, 0.85,
localized and metastatic PCa. Similarly, the f/tPSA 0.86 and 0.74, respectively. Thus, the combination
ratio exhibited a significant difference among control, of PSA with, IGF-1, IGFBP-3, and CgA improved the
localized and metastatic PCa groups (P < 0.005, Table sensitivity, specificity and diagnostic accuracy for PCa
1; Figure 1A and B). Surprisingly, while serum IGF-1 patients [Table 2 and Figure 2].
level showed no statistical difference between studied
groups, as it represented 155.0 ± 44.2 ng/mL in PCa DISCUSSION
group compared to 148.4 ± 36.1 ng/mL in control group
(P > 0.05) [Table 1 and Figure 1C], its combination with The successful treatment of PCa depends on
tPSA as IGF-1/tPSA ratio could differentiate significantly detection of the disease at its earliest stages. Since
between PCa, 148.4 ± 36.1, and control groups, 64.8 PCa is a heterogeneous disease, there is a need
± 22.3 (P < 0.005) [Table 1 and Figure 1C]. Similarly, for supplementary biomarkers that add useful
mean serum IGFBP-3 and CgA did not statistically information and correctly prognosticate the existence
differentiate between the PCa and control groups, as and progression of PCa to eliminate unnecessary
IGFBP-3 represented 3,052 ± 319 ng/mL and 3,154 ± invasive biopsies and aggressive diagnostic tools,
371 ng/mL in PCa and control groups respectively (P < decrease morbidity rates, and reduce unnecessary
0.05, Table 1 and Figure 1D) and CgA represented 65.4 expenses. Thus, many prospective PCa biomarkers
± 30.3 ng/mL and 62.1 ± 29.8 ng/mL in PCa and control will continue to develop and expand to improve and
groups respectively (P < 0.05, Table 1 and Figure 1D). provide more diagnostic information and supplement
On the other hand, statistical significance was noted PSA testing. A diversity of diagnostic and prognostic
for their ratios with tPSA, (IGFBP-3/tPSA and CgA/ markers had been explored in different body fluids and
tPSA ratios), in distinguishing PCa and control groups tissue samples, although their clinical use still need
(P < 0.005, Table 1 and Figure 1E). further validation. The ideal PCa biomarkers should
be prostate specific, readily detectable in the body
The validity (sensitivity and specificity), and accuracy fluids, reproducibly measured and analysed, and can
of each parameter for prediction of PCa occurrence effectively differentiate among normal, benign and
were calculated by AUC in ROC curve analysis of cancerous prostatic diseases as well as have cogent
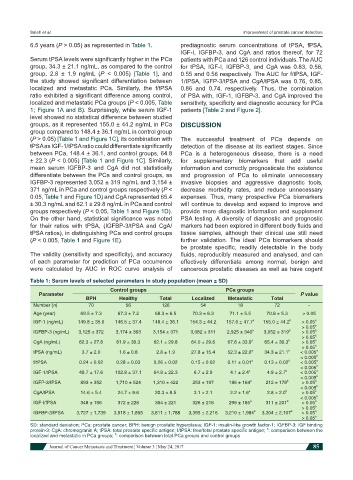
Table 1: Serum levels of selected parameters in study population (mean ± SD)
Control groups PCa groups
Parameter P value
BPH Healthy Total Localized Metastatic Total
Number (n) 70 56 126 54 18 72 -
Age (year) 69.5 ± 7.3 67.3 ± 7.2 68.3 ± 6.5 70.3 ± 6.3 71.1 ± 5.5 70.8 ± 5.3 > 0.05
IGF-1 (ng/mL) 149.8 ± 35.6 146.5 ± 37.4 148.4 ± 36.1 154.3 ± 44.2 157.6 ± 47.7 a 155.0 ± 44.2 b > 0.05 a
> 0.05 b
IGFBP-3 (ng/mL) 3,125 ± 372 3,174 ± 363 3,154 ± 371 3,082 ± 311 2,925 ± 346 a 3,052 ± 319 b > 0.05 a
> 0.05 b
CgA (ng/mL) 62.3 ± 27.6 61.9 ± 30.3 62.1 ± 29.8 64.0 ± 29.6 67.6 ± 33.9 a 65.4 ± 30.3 b > 0.05 a
> 0.05 b
tPSA (ng/mL) 3.7 ± 2.0 1.6 ± 0.8 2.8 ± 1.9 27.8 ± 15.4 52.3 ± 22.6 a 34.3 ± 21.1 b < 0.005 a
< 0.005 b
f/tPSA 0.24 ± 0.02 0.28 ± 0.03 0.26 ± 0.02 0.15 ± 0.02 0.11 ± 0.01 a 0.13 ± 0.02 b < 0.005 a
< 0.005 b
IGF-1/tPSA 49.7 ± 17.6 102.8 ± 37.1 64.8 ± 22.3 6.7 ± 2.9 4.1 ± 2.4 a 4.9 ± 2.7 b < 0.005 a
< 0.005 b
IGFP-3/tPSA 893 ± 352 1,710 ± 524 1,310 ± 422 253 ± 197 186 ± 164 a 212 ± 178 b > 0.05 a
< 0.005 b
CgA/tPSA 14.6 ± 5.4 24.7 ± 9.6 20.3 ± 8.5 3.1 ± 2.1 2.2 ± 1.6 a 2.8 ± 2.0 b > 0.05 a
< 0.005 b
IGF-I/fPSA 348 ± 196 372 ± 228 364 ± 221 326 ± 216 296 ± 185 a 311 ± 201 b > 0.05 a
> 0.05 b
IGFBP-3/fPSA 3,727 ± 1,739 3,918 ± 1,865 3,811 ± 1,788 3,395 ± 2,216 3,210 ± 1,984 a 3,304 ± 2,107 b > 0.05 a
> 0.05 b
SD: standard deviation; PCa: prostate cancer; BPH: benign prostatic hyperplasia; IGF-1: insulin-like growth factor-1; IGFBP-3: IGF binding
protein-3; CgA: chromogranin A; tPSA: total prostate specific antigen; f/tPSA: free/total prostate specific antigen; : comparison between the
a
b
localized and metastatic in PCa groups; : comparison between total PCa groups and control groups
Journal of Cancer Metastasis and Treatment ¦ Volume 3 ¦ May 24, 2017 85