
Page 409 - Read Online
P. 409
Gonzalez et al. Sunitinib effectiveness and safety in Costa Rica
Table 2: Progression-free survival and overall survival by gender and histological variant
mPFS mOS
Gender Female 10.8 months (95% CI: 3.1-18.5) 18.0 months (95% CI: 13.2-22.8)
Male 15.2 months (95% CI: 10.9-19.5) 23.0 months (95% CI: 16.2-29.7)
(HR:1.21; 95% CI: 0.71-2.0; P = 0.49) (HR: 1.23 95% CI: 0.71-2.11; P = 0.46)
Histology Clear cell carcinoma 15.2 months (95% CI: 10.8-19.7) 26.8 months (95% CI: 20.1-30.5)
Non-clear cell carcinoma 8.2 months (95% CI: 0-19.5) 14.2 months (95% CI: 0-29.0)
HR: 1.84 (95% CI: 0.9-3.76); P = 0.089 HR: 3.41 (95% CI: 1.6-7.3); P = 0.001)
CI: confidence interval; HR: hazard ratio; mPFS: median progression-free survival; mOS: median overall survival
Table 3: Univariate and multivariate analyses of potential prognostic variables for overall survival
Variable Univariate hazard ratio (95% CI) P value Multivariate hazard ratio (95% CI) P value
Male sex 0.77 (0.44-1.36) 0.372 0.88 (0.49-1.55) 0.659
Clear cell histology 0.29 (0.13-0.63) 0.002* 0.34 (0.16-0.76) 0.008
Age ≥ 65 years 2.15 (1.26-3.69) 0.005* 1.97 (1.14-3.04) 0.015*
CI: confidence interval
Table 4: Univariate and multivariate analyses of potential prognostic variables for progression-free survival
Variable Univariate hazard ratio (95% CI) P value Multivariate hazard ratio (95% CI) P value
Male sex 0.82 (0.48-1.41) 0.497 0.81 (0.46-1.42) 0.464
Clear cell histology 0.54 (0.26-1.12) 0.096 0.62 (0.27-1.31) 0.214
Age ≥ 65 years 2.21 (1.31-3.72) 0.003* 2.21 (1.30-3.76) 0.003*
CI: confidence interval
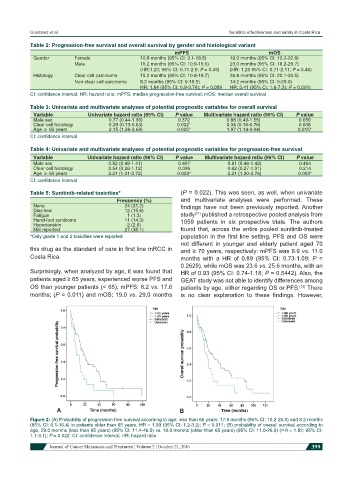
Table 5: Sunitinib-related toxicities* (P = 0.022). This was seen, as well, when univariate
Frequency (%) and multivariate analyses were performed. These
None 24 (31.2) findings have not been previously reported. Another
Diarrhea 12 (15.6) [21]
Fatigue 1 (1.3) study published a retrospective pooled analysis from
Hand-foot syndrome 11 (14.3) 1059 patients in six prospective trials. The authors
Hypertension 2 (2.6)
Not reported 27 (35.1) found that, across the entire pooled sunitinib-treated
*Only grade 1 and 2 toxicities were reported population in the first line setting, PFS and OS were
not different in younger and elderly patient aged 70
this drug as the standard of care in first line mRCC in and ≥ 70 years, respectively: mPFS was 9.9 vs. 11.0
Costa Rica. months with a HR of 0.89 (95% CI: 0.73-1.09; P =
0.2629), while mOS was 23.6 vs. 25.6 months, with an
Surprisingly, when analyzed by age, it was found that HR of 0.93 (95% CI: 0.74-1.18; P = 0.5442). Also, the
patients aged ≥ 65 years, experienced worse PFS and GEAT study was not able to identify differences among
OS than younger patients (< 65), mPFS: 8.2 vs. 17.6 patients by age, either regarding OS or PFS. There
[18]
months; (P = 0.011) and mOS: 19.0 vs. 29.0 months is no clear explanation to these findings. However,
Figure 2: (A) Probability of progression-free survival according to age: less than 65 years: 17.6 months (95% CI: 10.2-25.0) and 8.2 months
(95% CI: 0.1-16.4) in patients older than 65 years. HR = 1.93 (95% CI: 1.2-3.2); P = 0.011; (B) probability of overall survival according to
age, 29.0 months (less than 65 years) (95% CI: 11.4-46.5) vs. 19.0 months (older than 65 years) (95% CI: 11.0-26.9) (HR = 1.82; 95% CI:
1.1-3.1); P = 0.022. CI: confidence interval; HR: hazard ratio
Journal of Cancer Metastasis and Treatment ¦ Volume 2 ¦ October 21, 2016 399