
Page 78 - Read Online
P. 78
Common miRNA in Common miRNA in culture
TB0021_CTR1
TB0012_CTR2
D283 D341
MB cells medium
(348)
(355)
(262) (280)
D283
D283 D341 D341
(1787) (1662)
(1394) (1615)
57
25 49
1
7
10
156
1347
1083
329
24 18
11
15
75
86
DAOY DAOY
(1761) (1199)
DAOY
950
Common Common (273)
TB0011_MB
miRNA in
miRNA in
(441)
a b c
cells
medium
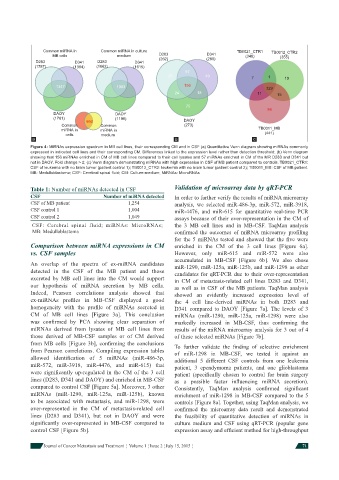
Figure 4: MiRNAs expression spectrum in MB cell lines, their corresponding CM and in CSF (a) Quantitative Venn diagram showing miRNAs commonly
expressed in indicated cell lines and their corresponding CM. Differences linked to the expression level rather than detection threshold; (b) Venn diagram
showing that 156 miRNAs enriched in CM of MB cell lines compared to their cell lysates and 57 miRNAs enriched in CM of the MR D283 and D341 but
not in DAOY. Fold change > 2; (c) Venn diagram demonstrating miRNAs with high expression in CSF of MB patient compared to controls. TB0021_CTR1:
CSF of leukemia with no brain tumor (patient control 1); TB0012_CTR2: leukemia with no brain tumor (patient control 2); TB0011_MB: CSF of MB patient.
MB: Medulloblastoma; CSF: Cerebral spinal fl uid; CM: Culture-medium; MiRNAs: MicroRNAs
Table 1: Number of miRNAs detected in CSF Validation of microarray data by qRT-PCR
CSF Number of miRNA detected In order to further verify the results of miRNA microarray
CSF of MB patient 1,254 analysis, we selected miR-486-3p, miR-572, miR-3918,
CSF control 1 1,004 miR-4476, and miR-615 for quantitative real-time PCR
CSF control 2 1,049 assays because of their over-representation in the CM of
CSF: Cerebral spinal fluid; miRNAs: MicroRNAs; the 3 MB cell lines and in MB-CSF. TaqMan analysis
MB: Medulloblastoma confi rmed the outcomes of miRNA microarray profi ling
for the 5 miRNAs tested and showed that the fi ve were
Comparison between miRNA expressions in CM enriched in the CM of the 3 cell lines [Figure 6a].
vs. CSF samples However, only miR-615 and miR-572 were also
accumulated in MB-CSF [Figure 6b]. We also chose
An overlap of the spectra of ex-miRNA candidates miR-1290, miR-125a, miR-125b, and miR-1298 as other
detected in the CSF of the MB patient and those candidates for qRT-PCR due to their over-representation
excreted by MB cell lines into the CM would support in CM of metastasis-related cell lines D283 and D341,
our hypothesis of miRNA secretion by MB cells. as well as in CSF of the MB patients. TaqMan analysis
Indeed, Pearson correlations analysis showed that showed an evidently increased expression level of
ex-miRNAs profi les in MB-CSF displayed a good the 4 cell line-derived miRNAs in both D283 and
homogeneity with the profi le of miRNAs secreted in D341 compared to DAOY [Figure 7a]. The levels of 3
CM of MB cell lines [Figure 3a]. This conclusion miRNAs (miR-1290, miR-125a, miR-1298) were also
was confi rmed by PCA showing clear separation of markedly increased in MB-CSF, thus confi rming the
miRNAs derived from lysates of MB cell lines from results of the miRNA microarray analysis for 3 out of 4
those derived of MB-CSF samples or of CM derived of these selected miRNAs [Figure 7b].
from MB cells [Figure 3b], confi rming the conclusions To further validate the fi nding of selective enrichment
from Pearson correlations. Compiling expression tables of miR-1298 in MB-CSF, we tested it against an
allowed identifi cation of 5 miRNAs (miR-486-3p, additional 5 different CSF controls from one leukemia
miR-572, miR-3918, miR-4476, and miR-615) that patient, 3 ependymoma patients, and one glioblastoma
were signifi cantly up-regulated in the CM of the 3 cell patient (specifi cally chosen to control for brain surgery
lines (D283, D341 and DAOY) and enriched in MB-CSF as a possible factor infl uencing miRNA secretion).
compared to control CSF [Figure 5a]. Moreover, 3 other Consistently, TaqMan analysis confi rmed signifi cant
miRNAs (miR-1290, miR-125a, miR-125b), known enrichment of miR-1298 in MB-CSF compared to the 5
to be associated with metastasis, and miR-1298, were controls [Figure 8a]. Together, using TaqMan analysis, we
over-represented in the CM of metastasis-related cell confi rmed the microarray data result and demonstrated
lines (D283 and D341), but not in DAOY and were the feasibility of quantitative detection of miRNAs in
signifi cantly over-represented in MB-CSF compared to culture medium and CSF using qRT-PCR (popular gene
control CSF [Figure 5b]. expression assay and effi cient method for high-throughput
Journal of Cancer Metastasis and Treatment ¦ Volume 1 ¦ Issue 2 ¦ July 15, 2015 ¦ 71