
Page 75 - Read Online
P. 75
Switzerland. Written informed consent was obtained and Diagnostics. Basel, Switzerland) gel and quantifi ed
from each patient. CSF samples from patients with MB using Nanodrop Photometer [Figure 1a and b].
were collected 3 weeks after surgery and before start Labeling and hybridization
of radiotherapy or chemotherapy. CSF samples were
centrifuged (500 g, 10 min, room temperature) within Total RNA (250 ng) extracted from cells and 3 μL of
60 min after collection to remove cells and debris and concentrated small RNA extracted from medium were
were stored at -80 °C until further processing. used with Toray 3D-Gene miRNA labeling kit (Toray,
Japan) in presence of spikes used as positive controls.
Human MB cell lines
Briefl y, 5’-phosphates were removed from miRNA end
Human MB cell lines (DAOY and D283) were purchased using alkaline phosphatase and a fl uorescent label was
from American Type Culture Collection (Manassas, VA, enzymatically attached to the 3’-end of the miRNA. After
USA). D341 human MB cells were the kind gift of an enzyme inactivation step and addition of a hybridization
Dr. Henry Friedman (Duke University, Durham, UK). buffer, labeled miRNA was injected on 3D-Gene Human
MB cell lines were cultured as previously published miRNA Oligo Chips (Toray, Japan) targeting 2019 miRNA
[23]
and maintained at 37 °C in a humidifi ed atmosphere based on miRBase release 19. Finally, arrays were placed
with 5% CO . To isolate RNA from cultured medium, in a hybridization chamber and set into a 32 °C oven for
2
10.000-20.000/mL DAOY cells or 20.000-40.000/mL 16 h with a shaker adjusted to 250 rpm.
D341, D283, and T293 cells were plated and left to Washing and scanning
grow in their conditioned media for 72 h in 24 wells
plates. Conditioned medium (2 mL) of each cell lines Arrays were washed using 3 solutions with different
were centrifuged at 1,200 rpm to remove cells. The stringencies to remove non-specifi cally bound miRNAs.
supernatant was then centrifuged at 10,000 rpm to Then, arrays were scanned with the 3D-Gene Scanner
remove debris. 3000 instrument (Toray, Japan) to measure fl uorescence.
Scanning was carried out using 3 different photomultiplier
RNA extraction for microarray
sensitivities (PMT gain) to allow optimizing of signal
Total RNA from cell cultures or CSF were extracted detection and checking for consistency.
using a mix of Qiazol, Qiagen (Qiagen, Basel, Microarray analysis
Switzerland) and chloroform directly on cells. For small
RNA in conditioned medium or CSF, the addition of Images were analyzed with the 3D-Gene Extraction
miRNAs extraction reagent (Toray) was performed. software (Toray, Japan). After completion of the
In both situations, a centrifugation step was required auto-analysis work followed on image fi les, raw
to collect aqueous phase containing RNA that was signals, and detection calls was produced in tabular
fi nally transferred to miRNeasy Mini spin column fi les. GeneSpring GX12 (Agilent) was then used to
from miRNeasy purifi cation kit Qiagen (Qiagen, Basel, apply quantile normalization and differential expression
Switzerland). After subsequent washing steps, RNAs analysis using modifi ed t-test implemented in the
were eluted using 30 μL of nuclease-free water and software. Experimental variability was assessed with
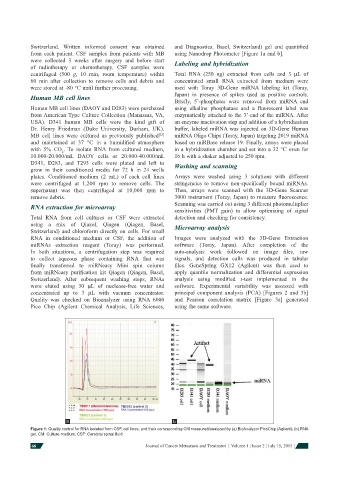
concentrated up to 3 μL with vacuum concentrator. principal component analysis (PCA) [Figures 2 and 3b]
Quality was checked on Bioanalyzer using RNA 6000 and Pearson correlat ion matrix [Figure 3a] generated
Pico Chip (Agilent Chemical Analysis, Life Sciences, using the same software.
a b
Figure 1: Quality control for RNA isolated from CSF, cell lines, and their corresponding CM measured/analyzed by (a) BioAnalyzer PicoChip (Agilent); (b) RNA
gel. CM: Culture-medium; CSF: Cerebral spinal fl uid
68 Journal of Cancer Metastasis and Treatment ¦ Volume 1 ¦ Issue 2 ¦ July 15, 2015 ¦