
Page 25 - Read Online
P. 25
analyzed by 2% agarose gel electrophoresis. The cut site Considering the difference in mean age between the
for Tr u1I (MseI) was 5’-TTAA-3’. two study groups, we analyzed polymorphisms of
CTLA-4 gene in all participants according to age groups
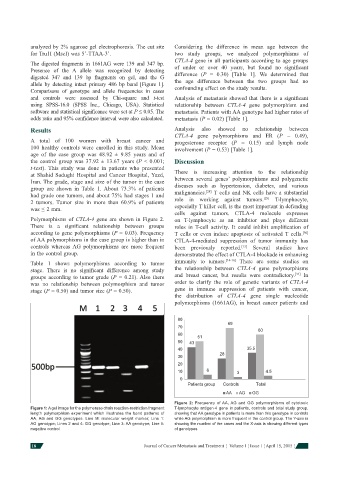
The digested fragments in 1661AG were 139 and 347 bp.
Presence of the A allele was recognized by detecting of under or over 40 years, but found no signifi cant
digested 347 and 139 bp fragments on gel , and the G difference (P = 0.30) [Table 1]. We determined that
allele by detecting intact primary 486 bp band [Figure 1]. the age difference between the two groups had no
Comparisons of genotype and allele frequencies in cases confounding effect on the study results.
and controls were assessed by Chi-square and t-test Analysis of metastasis showed that there is a signifi cant
using SPSS-16.0 (SPSS Inc., Chicago, USA). Statistical relationship between CTLA-4 gene polymorphism and
software and statistical signifi cance were set at P ≤ 0.05. The metastasis. Patients with AA genotype had higher rates of
odds ratio and 95% confi dence interval were also calculated. metastasis (P = 0.02) [Table 1].
Results Analysis also showed no relationship between
CTLA-4 gene polymorphisms and ER (P = 0.49),
A total of 100 women with breast cancer and progesterone receptor (P = 0.15) and lymph node
100 healthy controls were enrolled in this study. Mean involvement (P = 0.53) [Table 1].
age of the case group was 48.92 ± 9.85 years and of
the control group was 37.92 ± 13.67 years (P < 0.001; Discussion
t-test). This study was done in patients who presented
at Shahid Sadughi Hospital and Cancer Hospital, Yazd, There is increasing attention to the relationship
Iran. The grade, stage and size of the tumor in the case between several genes’ polymorphisms and polygenetic
group are shown in Table 1. About 73.3% of patients diseases such as hypertension, diabetes, and various
[28]
had grade one tumors, and about 75% had stages 1 and malignancies. T cells and NK cells have a substantial
[29]
2 tumors. Tumor size in more than 60.9% of patients role in working against tumors. T-lymphocyte,
was ≤ 2 mm. especially T killer cell, is the most important in defending
cells against tumors. CTLA-4 molecule expresses
Polymorphisms of CTLA-4 gene are shown in Figure 2. on T-lymphocyte as an inhibitor and plays different
There is a signifi cant relationship between groups roles in T-cell activity. It could inhibit amplifi cation of
according to gene polymorphisms (P = 0.03). Frequency T cells or even induce apoptosis of activated T cells.
[30]
of AA polymorphisms in the case group is higher than in CTLA-4-mediated suppression of tumor immunity has
controls whereas AG polymorphisms are more frequent been previously reported. Several studies have
[13]
in the control group. demonstrated the effect of CTLA-4 blockade in enhancing
Table 1 shows polymorphisms according to tumor immunity to tumors. [14-16] There are some studies on
stage. There is no signifi cant difference among study the relationship between CTLA-4 gene polymorphisms
[31]
groups according to tumor grade (P = 0.21). Also there and breast cancer, but results were contradictory. In
was no relationship between polymorphism and tumor order to clarify the role of genetic variants of CTLA-4
stage (P = 0.50) and tumor size (P = 0.50). gene in immune suppression of patients with cancer,
the distribution of CTLA-4 gene single nucleotide
polymorphisms (1661AG), in breast cancer patients and
80
69
70
60
60
51
50
43
35.5
40
28
30
20
6
10 4.5
3
0
Patients group Controls Total
AA AG GG
Figure 2: Frequency of AA, AG and GG polymorphisms of cytotoxic
Figure 1: A gel image for the polymerase chain reaction-restriction fragment T-lymphocyte antigen-4 gene in patients, controls and total study group,
length polymorphism experiment which illustrates the band patterns of showing that AA genotype in patients is more than this genotype in controls
AA, AG and GG genotypes. Line M: molecular weight marker; Line 1: while AG polymorphism is more frequent in the control group. The Y-axis is
AG genotype; Lines 2 and 4: GG genotype; Line 3: AA genotype; Line 5: showing the number of the cases and the X-axis is showing different types
negative control of genotypes
18 Journal of Cancer Metastasis and Treatment ¦ Volume 1 ¦ Issue 1 ¦ April 15, 2015 ¦