
Page 39 - Read Online
P. 39
Page 8 of 13 Briggs et al. J Cancer Metastasis Treat 2021;7:46 https://dx.doi.org/10.20517/2394-4722.2021.84
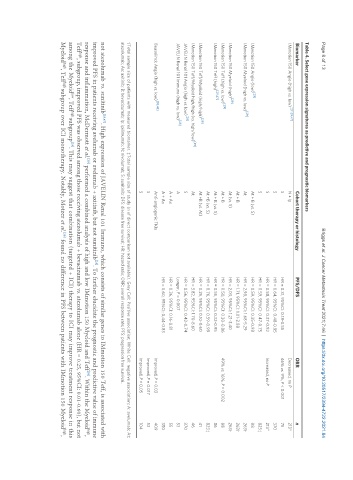
Table 4. Select gene expression signatures as predictive and prognostic biomarkers
Biomarker Cohort therapy or histology PFS/DFS ORR n
IMmotion 150 Angio (high vs. low) [27-29,47] N + Ip Decreased, no P 213†
S HR = 0.31, 95%CI: 0.18-0.55 46% vs. 9%, P < 0.001 75
S HR = 0.64, 95%CI: 0.48-0.85 370
S HR = 0.58, 95%CI: 0.37-0.92 Increased, no P 213†
S HR = 0.59, 95%CI: 0.47-0.75 823‡
IMmotion 150 Angio (low) [29] At + B (vs. S) HR = 0.59, 95%CI: 0.35-0.98 88
[29]
IMmotion 150 Myeloid (high vs. low) At HR = 2.98, 95%CI: 1.68-5.29 263†
At + B HR = 1.71, 95%CI: 1.01-2.88 263†
[29]
IMmotion 150 Myeloid (high) At (vs. S) HR = 2.03, 95%CI: 1.21-3.40 263†
IMmotion 150 Teff (high vs. low) [29] At + B HR = 0.50, 95%CI: 0.30-0.86 49% vs. 16%, P = 0.002 88
[29,47]
IMmotion 150 Teff (high) At + B (vs. S) HR = 0.55, 95%CI: 0.32-0.95 86
At +B (vs. S) HR = 0.76, 95%CI: 0.59-0.99 823‡
[29]
IMmotion 150 Teff/Myeloid (high/high) At +B (vs. At) HR = 0.25, 95%CI: 0.10-0.60 41
[29]
IMmotion 150 Teff/Myeloid high/high (vs. high/low) At HR = 3.82, 95%CI: 1.70-8.60 46
[28]
JAVELIN Renal 101 Angio (high vs. low) S HR = 0.56, 95%CI: 0.42-0.74 370
[28]
JAVELIN Renal 101 Immuno (high vs. low) A Longer, P = 0.007 53
A + Ax HR = 0.36, 95%CI: 0.16-0.81 55
A + Ax HR = 0.60, 95%CI: 0.44-0.83 350
Beuselinck Angio (high vs. low) [38,48] Anti-angiogenic TKIs Improved, P = 0.03 409
S Improved, P = 0.017 53
S Improved, P < 0.05 104
†Total sample size of patients with measured biomarker. ‡Total sample size of study (n of direct comparison not available). Grey Cell: Positive association; White Cell: negative association; A: avelumab; At:
atezolumab; Ax: axitinib; B: bevacizumab; Ip: ipilimumab; N: nivolumab; S: sunitinib; DFS: disease free survival; HR: hazard ratio; ORR: overall response rate; PFS: progression free survival.
not atezolumab vs. sunitinib [29,47] . High expression of JAVELIN Renal 101 Immuno, which consists of similar genes to IMmotion 150 Teff, is associated with
improved PFS in patients receiving avelumab or avelumab + axitinib, but not sunitinib . To further elucidate the prognostic and predictive value of immune
[28]
response and inflammation, McDermott et al. performed a combined analysis of high and low IMmotion 150 Myeloid and Teff . Within the Myeloid ,
[28]
high
[29]
Teff , subgroup, improved PFS was observed among those receiving atezolumab + bevacizumab vs. atezolumab alone (HR = 0.25, 95%CI: 0.01-0.60), but not
high
among the Myeloid , Teff subgroup . This may suggest that combination (targeted + ICI) therapy to ICI may improve treatment response in this
low
[29]
high
high
high
Myeloid , Teff subgroup over ICI monotherapy. Notably, Motzer et al. found no difference in PFS between patients with IMmotion 150 Myeloid ,
[28]
high