
Page 38 - Read Online
P. 38
Briggs et al. J Cancer Metastasis Treat 2021;7:46 https://dx.doi.org/10.20517/2394-4722.2021.84 Page 7 of 13
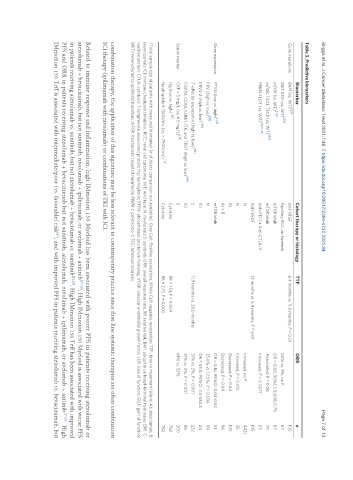
Table 3. Predictive biomarkers
Biomarker Cohort therapy or histology TTF ORR n
Gene mutations BAP1 (vs. WT) [23] anti-VEGF 6.4 months vs. 11.0 months, P = 0.01 105
[39]
MET GOF (vs. WT) Papillary RCC, on foretinib 50% vs. 9%, no P 67
[42]
mTOR (vs. WT) mTOR inhib OR = 0.08, 95%CI: 0.008-0.79 87
[40]
mTOR, TSC1, TSC2 (vs. WT) mTOR inhib Associated, P = 0.06 79
[23,31,33]
PBRM-1 LOF (vs. WT) Anti-PD-1 ± Anti-CTLA-4 Increased, P = 0.0071 63
Anti-VEGF 12 months vs. 6.9 months, P = 0.01 105
N Increased, no P 442†
N Increased, P = 0.012 35
At Decreased, P = 0.04 105
At + B Decreased, P = 0.04 96
[42]
Gene expression PTEN (low vs. high) mTOR inhib OR = 0.16, 95%CI: 0.04-0.62 53
[35]
ERV (high vs. low) N 35.6% vs. 12.5%, P = 0.036 99
[36]
ERV3-2 (high vs. low) ICI OR = 45.0, 95%CI: 3.5-584.3 24
[50]
T-effector expression (high vs. low) S 11.9 months vs. 28.0 months 31% vs. 2%, P = 0.001 232
FOXP3, CCR4, KLRK1, ITK, and TIGIT (high vs. low) [44] ICI 31% vs. 2%, P = 0.001 86
[18]
Serum marker CRP > 5 mg/L (vs. ≤ 5 mg/L) S 61% vs. 32% 200
Hg (low vs. high) [14] Cytokine RR = 1.51, P = 0.024 782
[14]
Neutrophils ≤ 7500/mL (vs. > 7500/mL) Cytokine RR = 2.13, P = 0.003 782
†Total sample size of patients with measured biomarker (n of direct comparison not available). Grey Cell: Positive association; White Cell: negative association; TTF: time to treatment failure; At: atezolumab; B:
bevacizumab; ICI: immune checkpoint inhibitor; RCC: renal cell carcinoma; WT: wild type; N: nivolumab; S: sunitinib; ORR: overall response rate; RR: relative risk; BAP: ubiquitin carboxyl-terminal hydrolase; CRP: C-
reactive protein; CTLA: cytotoxic T-lymphocyte-associated protein; Hg: hemoglobin; PTEN: phosphatase and tensin homolog; VEGF: vascular endothelial growth factor; LOF: loss of function; GOF: gain of function;
MET: mesenchymal to epithelial transition; mTOR: mechanistic target of rapamycin; PBRM-1: polybromo-1; TSC: tuberous sclerosis.
combination therapy, the application of this signature may be less relevant to contemporary practice since first-line systemic therapies are often combination
ICI therapy (ipilimumab with nivolumab) or combinations of TKI with ICI.
Related to immune response and inflammation, high IMmotion 150 Myeloid has been associated with poorer PFS in patients receiving atezolumab or
atezolumab + bevacizumab, but not sunitinib, nivolumab + ipilimumab, or avelumab + axitinib [27-29] . High IMmotion 150 Myeloid is associated with worse PFS
in patients receiving atezolumab vs. sunitinib, but not atezolumab + bevacizumab vs. sunitinib [28,29] . High IMmotion 150 Teff has been associated with improved
PFS and ORR in patients receiving atezolumab + bevacizumab but not sunitinib, atezolumab, nivolumab + ipilimumab, or avelumab + axitinib [27-29] . High
IMmotion 150 Teff is associated with intermediate/poor (vs. favorable) risk , and with improved PFS in patients receiving atezolumab vs. bevacizumab, but
[47]