
Page 36 - Read Online
P. 36
Briggs et al. J Cancer Metastasis Treat 2021;7:46 https://dx.doi.org/10.20517/2394-4722.2021.84 Page 5 of 13
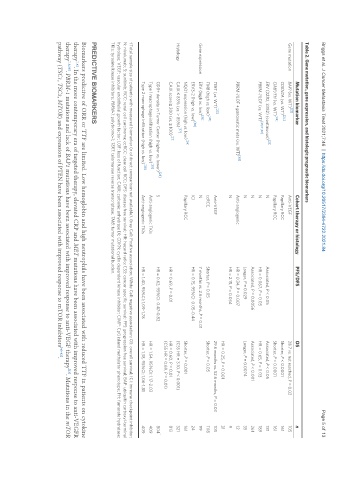
Table 2. Gene mutation, gene expression, and histologic prognostic biomarkers
Mutation biomarker Cohort therapy or histology PFS/DFS OS n
Gene mutation BAP1 (vs. WT) [23] Anti-VEGF 28.7 vs. not reached, P = 0.02 105
[24]
CDKN2A (vs. WT) Papillary RCC Shorter, P < 0.0001 161
[24]
CIMP/FH (vs. WT) Papillary RCC Shorter, P < 0.0001 161
[25]
ERV (2282, 3382) (continuous) N Associated, P < 0.05 Associated, P < 0.05 181
[25,31,32]
PBRM-1 LOF (vs. WT) N HR = 0.067, P = 0.03 HR = 0.65, P = 0.03 189
N Associated, P = 0.0056 Associated, P < 0.001 261
N Longer, P = 0.029 Longer, P = 0.0074 35
PBRM-1 LOF + pancreatic mets (vs. WT) [63] Anti-angiogenic HR = 0.34, P = 0.007 12
N HR = 2.15, P = 0.034 9
HR = 0.25, P < 0.001 31
[23]
TERT (vs. WT) Anti-VEGF 29.6 months vs. 52.6 months, P = 0.03 105
TMB (high vs. low) [45] ccRCC Shorter, P < 0.05 Shorter, P < 0.05 1118
[35]
Gene expression ERV (high vs. low) N 7 months vs. 2.6 months, P = 0.01 99
[36]
ERV3-2 (high vs. low) ICI HR = 0.15, 95%CI: 0.05-0.44 24
[24]
NQO1 expression (high vs. low) Papillary RCC Shorter, P = 0.001 161
[37]
Histology CAIX ≤ 85% (vs. > 85%) (CSS HR = 3.10, P < 0.001) 321
CAIX score ≥ 200 (vs. ≤ 100) [21] HR = 0.69, P = 0.01 HR = 0.60, P = 0.01 813
(CSS HR = 0.69, P = 0.01)
CD8+ density in Tumor Center (higher vs. lower) [28] S HR = 0.62, 95%CI: 0.47-0.82 804 †
[38]
Type 1 macrophage infiltration (high vs. low) Anti-angiogenic TKIs HR = 1.54, 95%CI: 1.17-2.03 409
Type 2 macrophage infiltration (high vs. low) [38] Anti-angiogenic TKIs HR = 1.40, 95%CI: 1.09-1.78 HR = 1.38, 95%CI: 1.06-1.81 409
†Total sample size of patients with measured biomarker (n of direct comparison not available). Grey Cell: Positive association; White Cell: negative association; OS: overall survival; ICI: immune checkpoint inhibitor;
N: nivolumab; S: sunitinib; RCC: renal cell carcinoma; ccRCC: clear cell RCC; DFS: disease free survival; HR: hazard ratio; CSS: cancer specific survival; PFS: progression free survival; BAP: ubiquitin carboxyl-terminal
hydrolase; VEGF: vascular endothelial growth factor; LOF: loss of function; CAIX: carbonic anhydrase IX; CDKN: cyclin dependent kinase inhibitor; CIMP: CpG island methylator phenotype; FH: fumarate hydratase;
TKIs: tyrosine kinase inhibitors; PBRM-1: polybromo-1; TERT: telomerase reverse transcriptase; TMB: tumor mutational burden.
PREDICTIVE BIOMARKERS
Biomarkers predictive of ORR or TTF are limited. Low hemoglobin and high neutrophils have been associated with reduced TTF in patients on cytokine
therapy . In the more contemporary era of targeted therapy, elevated CRP and MET mutations have been associated with improved response to anti-VEGFR
[14]
[23]
therapy [18,39] . PBRM-1 mutations and lack of BAP1 mutations have been associated with improved response to anti-VEGF therapy . Mutations in the mTOR
pathway (TSC1, TSC2, MTOR) and expression of PTEN have been associated with improved response to mTOR inhibitors [40-42] .