Page 41 - Read Online
P. 41

Page 10 of 13                                                  Briggs et al. J Cancer Metastasis Treat 2021;7:46  https://dx.doi.org/10.20517/2394-4722.2021.84

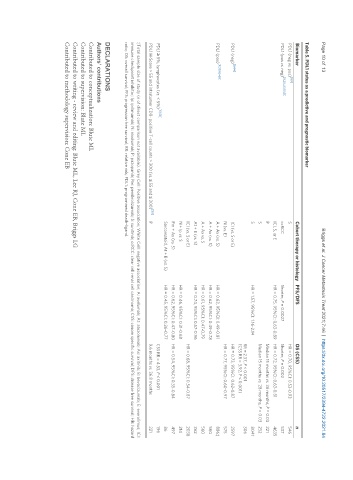
               Table 5. PDL1 status as a predictive and prognostic biomarker
                Biomarker                                                   Cohort therapy or histology PFS/DFS      OS (CSS)                    n
                PDL1 (neg vs. pos) [60]                                     S                                        HR = 0.70, 95%CI: 0.52-0.93  546
                           [9,28,45,50,51]
                PDL1 (pos vs. neg)                                          ccRCC                Shorter, P = 0.0027  Shorter, P = 0.002         537
                                                                            ICI, S, or E         HR = 0.75, 95%CI: 0.63-0.89 HR = 0.72, 95%CI: 0.63-0.81  4635
                                                                            P                                        Median 15 months vs. 36 months, P = 0.03 221
                                                                            S                                        Median 15 months vs. 28 months, P = 0.03 232
                                                                            S                    HR = 1.57, 95%CI: 1.16-2.14                     804†
                                                                                                                     RR = 2.37, P < 0.001        306
                                                                                                                     (CSS RR = 3.92, P < 0.001)
                      [9,64]
                PDL1 (neg)                                                  ICI (vs. S or E)                         HR = 0.73, 95%CI: 0.62-0.87  2597
                                                                            N (vs. E)                                HR = 0.77, 95%CI: 0.60-0.97  575
                      [9,30,65-68]
                PDL1 (pos)                                                  A + Ax (vs. S)       HR = 0.63, 95%CI: 0.49-0.81                     886‡
                                                                            A + Ax (vs. S)       HR = 0.62, 95%CI: 0.49-0.78                     560
                                                                            A + Ax vs. S         HR = 0.61, 95%CI: 0.47-0.79                     560
                                                                            At + B (vs. S)       HR = 0.74, 95%CI: 0.57-0.96                     362
                                                                            ICI (vs. S or E)                         HR = 0.68, 95%CI: 0.54-0.87  2038
                                                                            N + Ip vs. S         HR = 0.46, 95%CI: 0.31-0.68                     214
                                                                            Pm + Ax (vs. S)      HR = 0.62, 95%CI: 0.47-0.80 HR = 0.54, 95%CI: 0.35-0.84  497
                                                                            Sarcomatoid, At + B (vs. S)  HR = 0.45, 95%CI: 0.26-0.77             86
                PDL1 ≥ 5%, lymphocytes (vs. < 5%) [51,58]                                                            CSS RR = 4.53, P < 0.001    196
                                                                       [50]
                PDL1 H-Score > 55 and intratumor CD8- positive T-cell counts > 300 (vs. ≤ 55 and ≤ 300)  P           9.6 months vs. 36.8 months   221
               ‡Total sample size of study (n of direct comparison not available). Grey Cell: Positive association; White Cell: negative association; A: avelumab; At: atezolumab; Ax: axitinib; B: bevacizumab; E: everolimus; ICI:
               immune checkpoint inhibitor; Ip: ipilimumab; N: nivolumab; P: pazopanib; Pm: pembrolizumab; S: sunitinib; ccRCC: clear cell renal cell carcinoma; CSS: cancer specific survival; DFS: disease free survival; HR: hazard
               ratio; OS: overall survival; PFS: progression free survival; RR: relative risk; PDL1: programmed death-ligand.


               DECLARATIONS
               Authors’ contributions
               Contributed to conceptualization: Blute ML
               Contributed to supervision: Blute ML
               Contributed to writing - review and editing: Blute ML, Lee RJ, Cone EB, Briggs LG
               Contributed to methodology supervision: Cone EB
   36   37   38   39   40   41   42   43   44   45   46