
Page 8 - Read Online
P. 8
Page 4 of 16 Nagayama. J Cancer Metastasis Treat 2021;7:6 I http://dx.doi.org/10.20517/2394-4722.2020.114
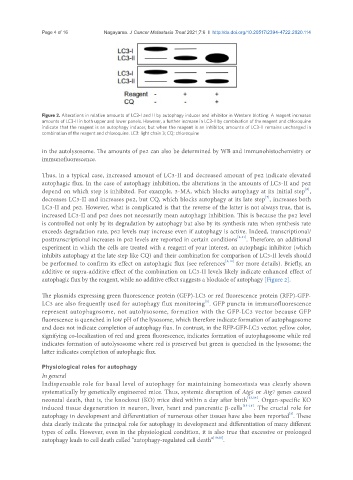
Figure 2. Alterations in relative amounts of LC3-I and II by autophagy inducer and inhibitor in Western blotting. A reagent increases
amounts of LC3-II in both upper and lower panels. However, a further increase in LC3-II by combination of the reagent and chloroquine
indicate that the reagent is an autophagy inducer, but when the reagent is an inhibitor, amounts of LC3-II remains unchanged in
combination of the reagent and chloroquine. LC3: light chain 3; CQ: chloroquine
in the autolysosome. The amounts of p62 can also be determined by WB and immunohistochemistry or
immunofluorescence.
Thus, in a typical case, increased amount of LC3-II and decreased amount of p62 indicate elevated
autophagic flux. In the case of autophagy inhibition, the alterations in the amounts of LC3-II and p62
[6]
depend on which step is inhibited. For example, 3-MA, which blocks autophagy at its initial step ,
[7]
decreases LC3-II and increases p62, but CQ, which blocks autophagy at its late step , increases both
LC3-II and p62. However, what is complicated is that the reverse of the latter is not always true, that is,
increased LC3-II and p62 does not necessarily mean autophagy inhibition. This is because the p62 level
is controlled not only by its degradation by autophagy but also by its synthesis rate; when synthesis rate
exceeds degradation rate, p62 levels may increase even if autophagy is active. Indeed, transcriptional/
posttranscriptional increases in p62 levels are reported in certain conditions [8-11] . Therefore, an additional
experiment in which the cells are treated with a reagent of your interest, an autophagic inhibitor (which
inhibits autophagy at the late step like CQ) and their combination for comparison of LC3-II levels should
be performed to confirm its effect on autophagic flux (see references [5,12] for more details). Briefly, an
additive or supra-additive effect of the combination on LC3-II levels likely indicate enhanced effect of
autophagic flux by the reagent, while no additive effect suggests a blockade of autophagy [Figure 2].
The plasmids expressing green fluorescence protein (GFP)-LC3 or red fluorescence protein (RFP)-GFP-
LC3 are also frequently used for autophagy flux monitoring . GFP puncta in immunofluorescence
[5]
represent autophagosome, not autolysosome, formation with the GFP-LC3 vector because GFP
fluorescence is quenched in low pH of the lysosome, which therefore indicate formation of autophagosome
and does not indicate completion of autophagy flux. In contrast, in the RFP-GFP-LC3 vector, yellow color,
signifying co-localization of red and green fluorescence, indicates formation of autophagosome while red
indicates formation of autolysosome where red is preserved but green is quenched in the lysosome; the
latter indicates completion of autophagic flux.
Physiological roles for autophagy
In general
Indispensable role for basal level of autophagy for maintaining homeostasis was clearly shown
systematically by genetically engineered mice. Thus, systemic disruption of Atg5 or Atg7 genes caused
neonatal death, that is, the knockout (KO) mice died within a day after birth [13,14] . Organ-specific KO
induced tissue degeneration in neuron, liver, heart and pancreatic β-cells [15-18] . The crucial role for
[3]
autophagy in development and differentiation of numerous other tissues have also been reported . These
data clearly indicate the principal role for autophagy in development and differentiation of many different
types of cells. However, even in the physiological condition, it is also true that excessive or prolonged
autophagy leads to cell death called “autophagy-regulated cell death” [19,20] .