
Page 96 - Read Online
P. 96
Ottewell et al. J Cancer Metastasis Treat 2021;7:11 https://dx.doi.org/10.20517/2394-4722.2021.14 Page 15 of 20
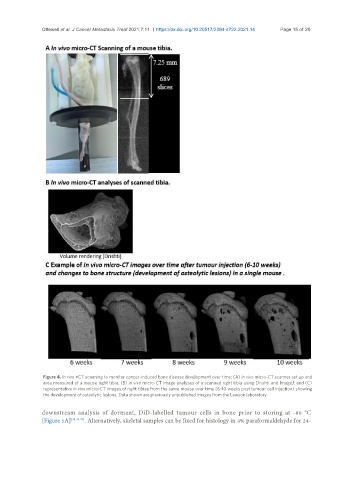
Figure 4. In vivo µCT scanning to monitor cancer-induced bone disease development over time: (A) in vivo micro-CT scanner set up and
area measured of a mouse right tibia; (B) in vivo micro-CT image analyses of a scanned right tibia using Drishti and ImageJ; and (C)
representative in vivo micro-CT images of right tibiae from the same mouse over time (6-10 weeks post tumour cell injection) showing
the development of osteolytic lesions. Data shown are previously unpublished images from the Lawson laboratory.
downstream analysis of dormant, DiD-labelled tumour cells in bone prior to storing at -80 °C
[Figure 1A] [38,42,43] . Alternatively, skeletal samples can be fixed for histology in 4% paraformaldehyde for 24-