
Page 42 - Read Online
P. 42
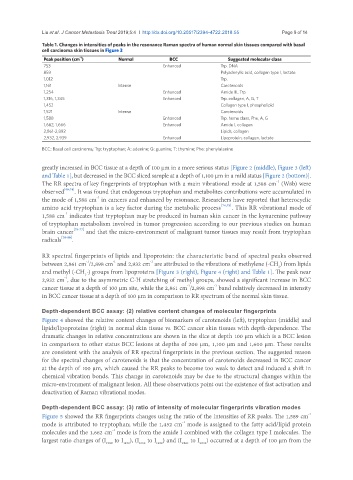
Liu et al. J Cancer Metastasis Treat 2019;5:4  I  http://dx.doi.org/10.20517/2394-4722.2018.55                                 Page 9 of 14

               Table 1. Changes in intensities of peaks in the resonance Raman spectra of human normal skin tissues compared with basal
               cell carcinoma skin tissues in Figure 3
                            -1
                Peak position (cm )      Normal           BCC                 Suggested molecular class
                753                                     Enhanced           Trp. DNA
                859                                                        Polyadenylic acid, collagen type I, lactate
                1,012                                                      Trp.
                1,161                    Intense                           Carotenoids
                1,254                                   Enhanced           Amide III, Trp.
                1,316, 1,345                            Enhanced           Trp. collagen, A, G, T
                1,452                                                      Collagen type I, phospholipid
                1,521                    Intense                           Carotenoids
                1,588                                   Enhanced           Trp. heme class, Phe, A, G
                1,662, 1,666                            Enhanced           Amide I, collagen
                2,861-2,892                                                Lipids, collagen
                2,932, 2,939                            Enhanced           Lipoprotein, collagen, lactate

               BCC: Basal cell carcinoma; Trp: tryptophan; A: adenine; G: guanine; T: thymine; Phe: phenylalanine

               greatly increased in BCC tissue at a depth of 100 µm in a more serious status [Figure 2 (middle), Figure 3 (left)
               and Table 1], but decreased in the BCC sliced sample at a depth of 1,100 µm in a mild status [Figure 2 (bottom)].
               The RR spectra of key fingerprints of tryptophan with a main vibrational mode at 1,588 cm  (W8b) were
                                                                                              -1
               observed [66,74] . It was found that endogenous tryptophan and metabolites contributions were accumulated in
                                  -1
               the mode of 1,588 cm  in cancers and enhanced by resonance. Researchers have reported that heterocyclic
               amino acid tryptophan is a key factor during the metabolic process [74,75] . This RR vibrational mode of
                       -1
               1,588 cm  indicates that tryptophan may be produced in human skin cancer in the kynurenine pathway
               of tryptophan metabolism involved in tumor progression according to our previous studies on human
               brain cancer [75-77]  and that the micro-environment of malignant tumor tissues may result from tryptophan
               radicals [78-80] .


               RR spectral fingerprints of lipids and lipoprotein: the characteristic band of spectral peaks observed
                                       -1
                              -1
                                                    -1
               between 2,861 cm /2,898 cm  and 2,932 cm  are attributed to the vibrations of methylene (-CH ) from lipids
                                                                                               2
               and methyl (-CH -) groups from lipoproteins [Figure 3 (right), Figure 4 (right) and Table 1]. The peak near
                              3
               2,932 cm , due to the asymmetric C-H stretching of methyl groups, showed a significant increase in BCC
                       -1
                                                                         -1
                                                                -1
               cancer tissue at a depth of 100 µm site, while the 2,861 cm /2,898 cm  band relatively decreased in intensity
               in BCC cancer tissue at a depth of 100 µm in comparison to RR spectrum of the normal skin tissue.
               Depth-dependent BCC assay: (2) relative content changes of molecular fingerprints
               Figure 4 showed the relative content changes of biomarkers of carotenoids (left), tryptophan (middle) and
               lipids/lipoproteins (right) in normal skin tissue vs. BCC cancer skin tissues with depth-dependence. The
               dramatic changes in relative concentrations are shown in the slice at depth 100 µm which is a BCC lesion
               in comparison to other status BCC lesions at depths of 200 µm, 1,100 µm and 1,600 µm. These results
               are consistent with the analysis of RR spectral fingerprints in the previous section. The suggested reason
               for the spectral changes of carotenoids is that the concentration of carotenoids decreased in BCC cancer
               at the depth of 100 µm, which caused the RR peaks to become too weak to detect and induced a shift in
               chemical vibration bonds. This change in carotenoids may be due to the structural changes within the
               micro-environment of malignant lesion. All these observations point out the existence of fast activation and
               deactivation of Raman vibrational modes.


               Depth-dependent BCC assay: (3) ratio of intensity of molecular fingerprints vibration modes
                                                                                                         -1
               Figure 5 showed the RR fingerprints changes using the ratio of the intensities of RR peaks. The 1,589 cm
                                                              -1
               mode is attributed to tryptophan; while the 1,452 cm  mode is assigned to the fatty acid/lipid protein
                                       -1
               molecules and the 1,662 cm  mode is from the amide I combined with the collagen type I molecules. The
               largest ratio changes of (I  to I ), (I  to I ) and (I  to I ) occurred at a depth of 100 µm from the
                                           1452
                                     1589
                                                              2861
                                                      1452
                                                                    2932
                                                1662