
Page 37 - Read Online
P. 37
Page 4 of 14 Liu et al. J Cancer Metastasis Treat 2019;5:4 I http://dx.doi.org/10.20517/2394-4722.2018.55
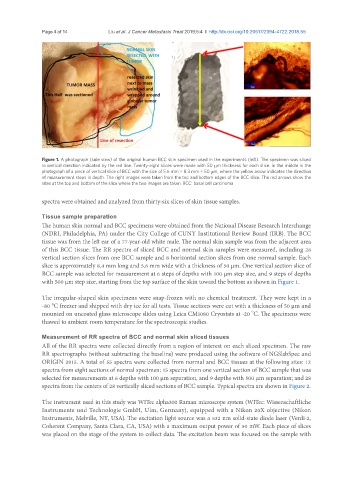
Figure 1. A photograph (side view) of the original human BCC skin specimen used in the experiments (left). The specimen was sliced
in vertical direction indicated by the red line. Twenty-eight slices were made with 50 µm thickness for each slice. In the middle is the
photograph of a piece of vertical slice of BCC with the size of 5.6 mm × 8.3 mm × 50 µm, where the yellow arrow indicates the direction
of measurement steps in depth. The right images were taken from the top and bottom edges of the BCC slice. The red arrows show the
sites at the top and bottom of the slice where the two images are taken. BCC: basal cell carcinoma
spectra were obtained and analyzed from thirty-six slices of skin tissue samples.
Tissue sample preparation
The human skin normal and BCC specimens were obtained from the National Disease Research Interchange
(NDRI, Philadelphia, PA) under the City College of CUNY Institutional Review Board (IRB). The BCC
tissue was from the left ear of a 77-year-old white male. The normal skin sample was from the adjacent area
of this BCC tissue. The RR spectra of sliced BCC and normal skin samples were measured, including 28
vertical section slices from one BCC sample and 8 horizontal section slices from one normal sample. Each
slice is approximately 8.4 mm long and 5.6 mm wide with a thickness of 50 µm. One vertical section slice of
BCC sample was selected for measurement at 6 steps of depths with 100 µm step size, and 9 steps of depths
with 500 µm step size, starting from the top surface of the skin toward the bottom as shown in Figure 1.
The irregular-shaped skin specimens were snap-frozen with no chemical treatment. They were kept in a
-80 °C freezer and shipped with dry ice for all tests. Tissue sections were cut with a thickness of 50 µm and
o
mounted on uncoated glass microscope slides using Leica CM1080 Cryostats at -20 C. The specimens were
thawed to ambient room temperature for the spectroscopic studies.
Measurement of RR spectra of BCC and normal skin sliced tissues
All of the RR spectra were collected directly from a region of interest on each sliced specimen. The raw
RR spectrographs (without subtracting the baseline) were produced using the software of NGSlabSpec and
ORIGIN 2015. A total of 55 spectra were collected from normal and BCC tissues at the following sites: 12
spectra from eight sections of normal specimen; 15 spectra from one vertical section of BCC sample that was
selected for measurements at 6 depths with 100 µm separation, and 9 depths with 500 µm separation; and 28
spectra from the centers of 28 vertically sliced sections of BCC sample. Typical spectra are shown in Figure 2.
The instrument used in this study was WITec alpha300 Raman microscope system (WITec: Wissenschaftliche
Instrumente und Technologie GmbH, Ulm, Germany), equipped with a Nikon 20X objective (Nikon
Instruments, Melville, NY, USA). The excitation light source was a 532 nm solid-state diode laser (Verdi-2,
Coherent Company, Santa Clara, CA, USA) with a maximum output power of 50 mW. Each piece of slices
was placed on the stage of the system to collect data. The excitation beam was focused on the sample with