
Page 62 - Read Online
P. 62
Narayanan et al. J Cancer Metastasis Treat 2019;5:36 I http://dx.doi.org/10.20517/2394-4722.2018.77 Page 5 of 11
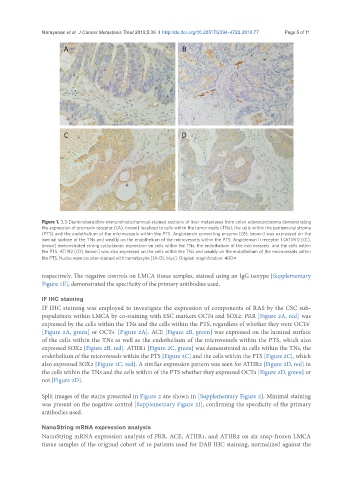
Figure 1. 3,3-Diaminobenzidine immunohistochemical-stained sections of liver metastases from colon adenocarcinoma demonstrating
the expression of pro-renin receptor [(A), brown] localized to cells within the tumor nests (TNs), the cells within the peritumoral stroma
(PTS) and the endothelium of the microvessels within the PTS. Angiotensin converting enzyme [(B), brown] was expressed on the
luminal surface of the TNs and weakly on the endothelium of the microvessels within the PTS. Angiotensin II receptor 1 (ATIIR1) [(C),
brown] demonstrated strong cytoplasmic expression on cells within the TNs, the endothelium of the microvessels and the cells within
the PTS. ATIIR2 [(D), brown] was also expressed on the cells within the TNs and weakly on the endothelium of the microvessels within
the PTS. Nuclei were counter-stained with hematoxylin [(A-D), blue]. Original magnification: 400×
respectively. The negative controls on LMCA tissue samples, stained using an IgG isotype [Supplementary
Figure 1E], demonstrated the specificity of the primary antibodies used.
IF IHC staining
IF IHC staining was employed to investigate the expression of components of RAS by the CSC sub-
populations within LMCA by co-staining with ESC markers OCT4 and SOX2. PRR [Figure 2A, red] was
+
expressed by the cells within the TNs and the cells within the PTS, regardless of whether they were OCT4
-
[Figure 2A, green] or OCT4 [Figure 2A]. ACE [Figure 2B, green] was expressed on the luminal surface
of the cells within the TNs as well as the endothelium of the microvessels within the PTS, which also
expressed SOX2 [Figure 2B, red]. ATIIR1 [Figure 2C, green] was demonstrated in cells within the TNs, the
endothelium of the microvessels within the PTS [Figure 2C] and the cells within the PTS [Figure 2C], which
also expressed SOX2 [Figure 2C, red]. A similar expression pattern was seen for ATIIR2 [Figure 2D, red] in
the cells within the TNs and the cells within of the PTS whether they expressed OCT4 [Figure 2D, green] or
not [Figure 2D].
Split images of the stains presented in Figure 2 are shown in [Supplementary Figure 2]. Minimal staining
was present on the negative control [Supplementary Figure 2I], confirming the specificity of the primary
antibodies used.
NanoString mRNA expression analysis
NanoString mRNA expression analysis of PRR, ACE, ATIIR1, and ATIIR2 on six snap-frozen LMCA
tissue samples of the original cohort of 16 patients used for DAB IHC staining, normalized against the