
Page 23 - Read Online
P. 23
Lei et al. Intell Robot 2022;2(4):31332 I http://dx.doi.org/10.20517/ir.2022.18 Page 329
Figure 11. Different trajectories generated by updated historical data: (A) the planned trajectory with previous data; (B) the new planned
trajectory with new data; and (C) heat map with different historical data.
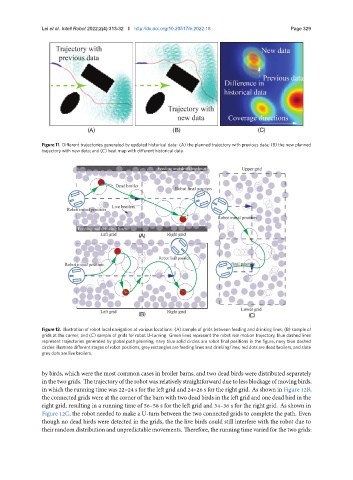
Figure 12. Illustration of robot local navigation at various locations: (A) sample of grids between feeding and drinking lines; (B) sample of
grids at the corner; and (C) sample of grids for robot U-turning. Green lines represent the robot real motion trajectory, blue dashed lines
represent trajectories generated by global path planning, navy blue solid circles are robot final positions in the figure, navy blue dashed
circles illustrate different stages of robot positions, grey rectangles are feeding lines and drinking lines, red dots are dead broilers, and slate
grey dots are live broilers.
by birds, which were the most common cases in broiler barns, and two dead birds were distributed separately
in the two grids. The trajectory of the robot was relatively straightforward due to less blockage of moving birds,
in which the running time was 22–24 s for the left grid and 24–26 s for the right grid. As shown in Figure 12B,
the connected grids were at the corner of the barn with two dead birds in the left grid and one dead bird in the
right grid, resulting in a running time of 56–58 s for the left grid and 34–36 s for the right grid. As shown in
Figure 12C, the robot needed to make a U-turn between the two connected grids to complete the path. Even
though no dead birds were detected in the grids, the the live birds could still interfere with the robot due to
their random distribution and unpredictable movements. Therefore, the running time varied for the two grids: