Page 47 - Read Online
P. 47

Page 240                         Yang et al. Intell Robot 2022;2(3):223­43  I http://dx.doi.org/10.20517/ir.2022.19


                                 0.18                           1.4
                                 0.16
                                                                1.2
                                         10 -3
                                 0.14  12
                                                                1 0.8  0.035
                                The norm square of consensus error  0.08 0.1  6 4 2 0  The norm square of consensus error  0.6 0.4  0.015
                                       10
                                 0.12
                                        8
                                                                     0.025
                                                                     0.005
                                 0.06
                                 0.04
                                 0.02  -2 25  30  35  40  45    0.2  -0.005 25  30  35  40  45
                                                                0
                                  0
                                 -0.02                         -0.2
                                  0   10  20  30  40  50  60    0   10  20  30  40  50  60
                                             Time(s)                       Time(s)
                                 0.4                            0.4
                                 0.35                          0.35
                                 0.3  0.025                    0.25 0.3  0.032
                                The norm square of consensus error  0.15 0.2  0.015  The norm square of consensus error  0.15 0.2  0.018
                                 0.25
                                                                     0.025
                                                                     0.011
                                      0.005
                                                                     0.004
                                 0.05 0.1  -0.005 25  30  35  40  45  0.05 0.1  -0.003 25  30  35  40  45
                                  0                             0
                                 -0.05                         -0.05
                                  0   10  20  30  40  50  60    0   10  20  30  40  50  60
                                             Time(s)                       Time(s)
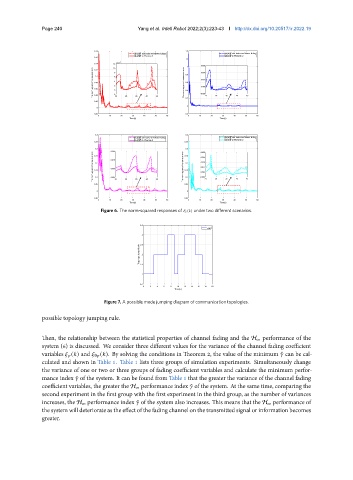
                                   Figure 6. The norm-squared responses of       (  ) under two different scenarios.
                                                3.5
                                                 3
                                                Topology Jump Mode  2.5 2


                                                1.5
                                                 1
                                                0.5
                                                 0  2  4  6  8  10  12  14  16  18  20
                                                            Time(s)
                                    Figure 7. A possible mode jumping diagram of communication topologies.

               possible topology jumping rule.


               Then, the relationship between the statistical properties of channel fading and the H ∞ performance of the
               system (6) is discussed. We consider three different values for the variance of the channel fading coefficient
               variables       (  ) and    0   (  ). By solving the conditions in Theorem 2, the value of the minimum ˆ   can be cal-
               culated and shown in Table 1. Table 1 lists three groups of simulation experiments. Simultaneously change
               the variance of one or two or three groups of fading coefficient variables and calculate the minimum perfor-
               mance index ˆ   of the system. It can be found from Table 1 that the greater the variance of the channel fading
               coefficient variables, the greater the H ∞ performance index ˆ   of the system. At the same time, comparing the
               second experiment in the first group with the first experiment in the third group, as the number of variances
               increases, the H ∞ performance index ˆ   of the system also increases. This means that the H ∞ performance of
               the system will deteriorate as the effect of the fading channel on the transmitted signal or information becomes
               greater.
   42   43   44   45   46   47   48   49   50   51   52