Page 46 - Read Online
P. 46

Yang et al. Intell Robot 2022;2(3):223­43  I http://dx.doi.org/10.20517/ir.2022.19  Page 239


                  0.5                            1                            0.55
                                                      0.2
                                                                                    0.065
                  0.3                           0.7                                 0.025
                                                       0                      0.35
                                                                                    -0.015
                  0.1                           0.4   -0.2
                                                       25  30  35  40  45     0.15  -0.055 25  30  35  40  45
                 Error Responses  -0.1  0.06    Error Responses  0.1          Error Responses
                  -0.3  0.02                    -0.2                          -0.05
                        -0.02
                                                                              -0.25
                  -0.5  -0.06                   -0.5
                         25  30  35  40  45
                  -0.7                          -0.8                          -0.45
                   0   10  20  30  40  50  60    0   10  20  30  40  50  60     0  10  20  30  40  50  60
                              Time(s)                       Time(s)                       Time(s)
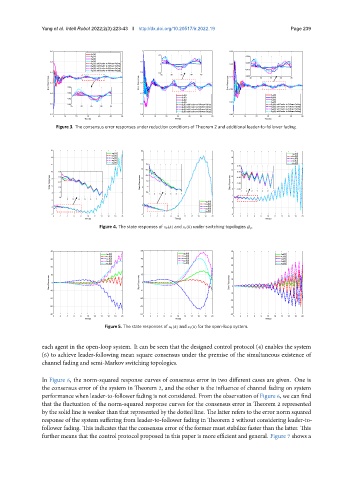
                    Figure 3. The consensus error responses under reduction conditions of Theorem 2 and additional leader-to-follower fading.


                  16                             24                            22
                  14                                                           19
                                                 20
                  12                              0.4                          16
                                                                                 0.75
                                                 16
                                                  -0.2                         13
                  10  0.6                         -0.8                         10  0.15
                  State Responses  8 6  -0.2 0.2  State Responses  12  -1.4    State Responses  7  -0.45
                                                                                 -1.05
                                                  -2
                                                 8
                     -0.6
                                                                               4
                                                                                 -1.65
                                                                                  1  2  3  4  5  6  7
                     -1                           -2.6
                  4                                1  2  3  4  5  6  7
                                                 4                             1
                     -1.4
                  2     2  3  4  5  6  7  8
                                                                               -2
                                                 0
                  0                                                            -5
                  -2                             -4                            -8
                   0  2  4  6  8  10  12  14  16  18  20  0  2  4  6  8  10  12  14  16  18  20  0  2  4  6  8  10  12  14  16  18  20
                              Time(s)                       Time(s)                       Time(s)
                                   Figure 4. The state responses of    0 (  ) and       (  ) under switching topologies G   .
                  40                            60                             50
                  30                            45                             40
                                                                               30
                  20                            30
                                                                               20
                  10                            15
                  State Responses  0            State Responses  0            State Responses  10 0
                  -10                           -15
                                                                               -10
                  -20                           -30
                                                                               -20
                  -30                           -45
                                                                               -30
                  -40                           -60                            -40
                   0  2  4  6  8  10  12  14  16  18  20  0  2  4  6  8  10  12  14  16  18  20  0  2  4  6  8  10  12  14  16  18  20
                              Time(s)                       Time(s)                       Time(s)
                                    Figure 5. The state responses of    0 (  ) and       (  ) for the open-loop system.
               each agent in the open-loop system. It can be seen that the designed control protocol (4) enables the system
               (6) to achieve leader-following mean square consensus under the premise of the simultaneous existence of
               channel fading and semi-Markov switching topologies.
               In Figure 6, the norm-squared response curves of consensus error in two different cases are given. One is
               the consensus error of the system in Theorem 2, and the other is the influence of channel fading on system
               performance when leader-to-follower fading is not considered. From the observation of Figure 6, we can find
               that the fluctuation of the norm-squared response curves for the consensus error in Theorem 2 represented
               by the solid line is weaker than that represented by the dotted line. The latter refers to the error norm squared
               response of the system suffering from leader-to-follower fading in Theorem 2 without considering leader-to-
               follower fading. This indicates that the consensus error of the former must stabilize faster than the latter. This
               further means that the control protocol proposed in this paper is more efficient and general. Figure 7 shows a
   41   42   43   44   45   46   47   48   49   50   51