
Page 38 - Read Online
P. 38
Page 33 Ayass et al. Intell Robot 2022;2(1):20-36 https://dx.doi.org/10.20517/ir.2021.07
Figure 7. Throughput of Network II.
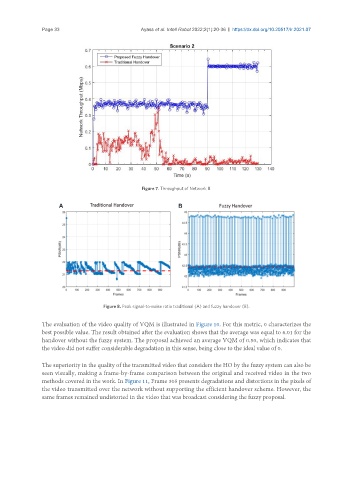
Figure 8. Peak signal-to-noise ratio traditional (A) and fuzzy handover (B).
The evaluation of the video quality of VQM is illustrated in Figure 10. For this metric, 0 characterizes the
best possible value. The result obtained after the evaluation shows that the average was equal to 6.01 for the
handover without the fuzzy system. The proposal achieved an average VQM of 0.50, which indicates that
the video did not suffer considerable degradation in this sense, being close to the ideal value of 0.
The superiority in the quality of the transmitted video that considers the HO by the fuzzy system can also be
seen visually, making a frame-by-frame comparison between the original and received video in the two
methods covered in the work. In Figure 11, Frame 305 presents degradations and distortions in the pixels of
the video transmitted over the network without supporting the efficient handover scheme. However, the
same frames remained undistorted in the video that was broadcast considering the fuzzy proposal.