Page 50 - Read Online
P. 50

Ortiz et al. Intell Robot 2021;1(2):131-50  I http://dx.doi.org/10.20517/ir.2021.09     Page 143


                                         100
                                         100                 B
                                                              SLAM
                                                                           x
                                          90
                                          90                                T
                                          80
                                          80   B
                                                unknow
                                          70
                                          70
                                          60
                                          60
                                         y [m]  50
                                          50
                                                   f*
                                          40
                                          40
                                          30
                                          30
                                          20
                                          20
                                             x
                                              S
                                          10
                                          10
                                          0 0
                                                  20
                                                                              100
                                                                           90
                                                             50
                                                         40
                                           0 0  10  20  30  40  50  60  70  80  90  100
                                              10
                                                                       80
                                                                    70
                                                                60
                                                      30
                                                            x [m]
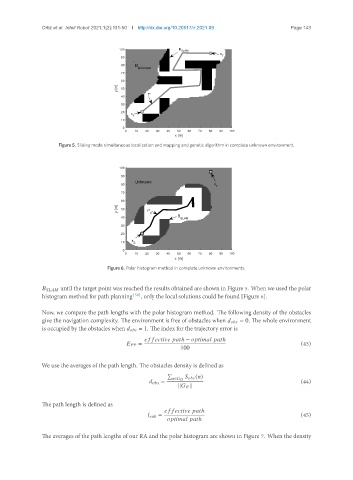
                     Figure 5. Sliding mode simultaneous localization and mapping and genetic algorithm in complete unknown environment.
                                         100
                                         100
                                          90
                                          90
                                               Unknown
                                          80
                                          80                             x
                                                                          T
                                          70
                                          70
                                          60
                                          60
                                         y [m]  50  f*
                                          50
                                                    h
                                                             B
                                          40
                                          40                  SLAM
                                          30
                                          30
                                          20
                                          20
                                             x
                                          10
                                          10  S
                                          0 0
                                                             50
                                                         40
                                                                           90
                                                                              100
                                                                       80
                                                                60
                                                                    70
                                              10
                                                      30
                                                  20
                                           0 0  10  20  30  40  50  60  70  80  90  100
                                                            x [m]
                                     Figure 6. Polar histogram method in complete unknown environments.
                           until the target point was reached the results obtained are shown in Figure 5. When we used the polar
               histogram method for path planning [50] , only the local solutions could be found [Figure 6].
               Now, we compare the path lengths with the polar histogram method. The following density of the obstacles
               give the navigation complexity. The environment is free of obstacles when           = 0. The whole environment
               is occupied by the obstacles when           = 1. The index for the trajectory error is
                                                                              ℎ −                      ℎ
                                                    =                                                 (43)
                                                              100
               We use the averages of the path length. The obstacles density is defined as
                                                         Í
                                                                         (  )
                                                             ∈     
                                                             =                                        (44)
                                                             k      k
               The path length is defined as
                                                                                    ℎ
                                                             =                                        (45)
                                                                              ℎ
               The averages of the path lengths of our RA and the polar histogram are shown in Figure 7. When the density
   45   46   47   48   49   50   51   52   53   54   55