
Page 64 - Read Online
P. 64
Page 285 Zhuang et al. Intell Robot 2024;4(3):276-92 I http://dx.doi.org/10.20517/ir.2024.18
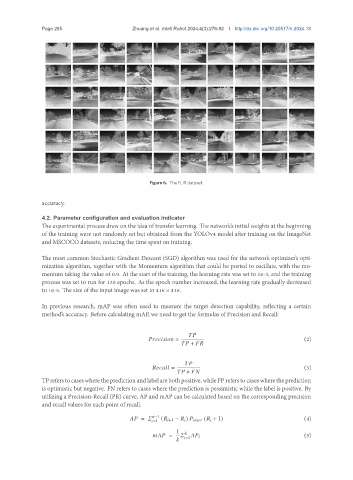
Figure 6. The FLIR dataset.
accuracy.
4.2. Parameter configuration and evaluation indicator
The experimental process drew on the idea of transfer learning. The network’s initial weights at the beginning
of the training were not randomly set but obtained from the YOLOv4 model after training on the ImageNet
and MSCOCO datasets, reducing the time spent on training.
The most common Stochastic Gradient Descent (SGD) algorithm was used for the network optimizer’s opti-
mization algorithm, together with the Momentum algorithm that could be ported to oscillate, with the mo-
mentum taking the value of 0.9. At the start of the training, the learning rate was set to 1e-3, and the training
process was set to run for 120 epochs. As the epoch number increased, the learning rate gradually decreased
to 1e-5. The size of the input image was set to 416 × 416.
In previous research, mAP was often used to measure the target detection capability, reflecting a certain
method’s accuracy. Before calculating mAP, we need to get the formulas of Precision and Recall:
= (2)
+
= (3)
+
TPreferstocaseswherethepredictionandlabelareboth positive, while FP referstocases wheretheprediction
is optimistic but negative. FN refers to cases where the prediction is pessimistic while the label is positive. By
utilizing a Precision-Recall (PR) curve, AP and mAP can be calculated based on the corresponding precision
and recall values for each point of recall.
= −1 ( +1 − ) ( + 1) (4)
=1
1
= =1 (5)
