
Page 67 - Read Online
P. 67
Zhuang et al. Intell Robot 2024;4(3):276-92 I http://dx.doi.org/10.20517/ir.2024.18 Page 288
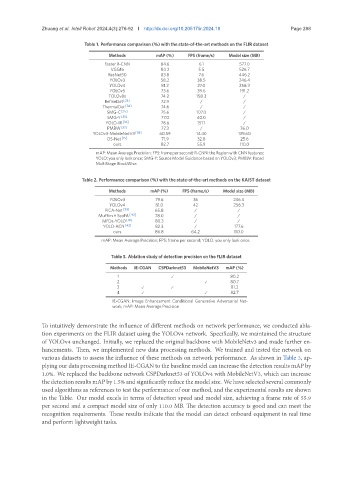
Table 1. Performance comparison (%) with the state-of-the-art methods on the FLIR dataset
Methods mAP (%) FPS (frame/s) Model size (MB)
Faster R-CNN 84.6 6.1 577.0
VGG16 84.2 5.5 526.7
ResNet50 83.8 7.6 446.2
YOLOv3 58.2 38.5 246.4
YOLOv4 81.2 27.0 256.3
YOLOv5 73.6 39.6 191.2
TOLOv8s 74.2 158.3 /
RefineDet [33] 72.9 / /
ThermalDet [34] 74.6 / /
SMG-C [35] 75.6 107.0 /
SMG-Y [35] 77.0 40.0 /
YOLO-IR [36] 78.6 151.1 /
PMBW [37] 77.3 / 36.0
YOLOv3-MobileNetV3 [38] 60.59 14.40 139.60
DS-Net [15] 71.9 32.8 25.6
ours 82.7 55.9 110.0
mAP: Mean Average Precision; FPS: frame per second; R-CNN: the Region with CNN features;
YOLO: you only look once; SMG-Y: Source Model Guidance based on YOLOv3; PMBW: Paced
MultiStage BlockWise.
Table 2. Performance comparison (%) with the state-of-the-art methods on the KAIST dataset
Methods mAP (%) FPS (frame/s) Model size (MB)
YOLOv3 79.6 36 246.4
YOLOv4 81.0 42 256.3
PiCA-Net [39] 65.8 / /
MuFEm + ScoFA [40] 78.0 / /
MFDs-YOLO [41] 80.3 / /
YOLO-ACN [42] 82.3 / 177.6
ours 86.8 64.2 110.0
mAP: Mean Average Precision; FPS: frame per second; YOLO: you only look once.
Table 3. Ablation study of detection precision on the FLIR dataset
Methods IE-CGAN CSPDarknet53 MobileNetV3 mAP (%)
1 ✓ 80.2
2 ✓ 80.7
3 ✓ ✓ 81.2
4 ✓ ✓ 82.7
IE-CGAN: Image Enhancement Conditional Generative Adversarial Net-
work; mAP: Mean Average Precision.
To intuitively demonstrate the influence of different methods on network performance, we conducted abla-
tion experiments on the FLIR dataset using the YOLOv4 network. Specifically, we maintained the structure
of YOLOv4 unchanged. Initially, we replaced the original backbone with MobileNetv3 and made further en-
hancements. Then, we implemented new data processing methods. We trained and tested the network on
various datasets to assess the influence of these methods on network performance. As shown in Table 3, ap-
plying our data processing method IE-CGAN to the baseline model can increase the detection results mAP by
1.0%. We replaced the backbone network CSPDarknet53 of YOLOv4 with MobileNetV3, which can increase
the detection results mAP by 1.5% and significantly reduce the model size. We have selected several commonly
used algorithms as references to test the performance of our method, and the experimental results are shown
in the Table. Our model excels in terms of detection speed and model size, achieving a frame rate of 55.9
per second and a compact model size of only 110.0 MB. The detection accuracy is good and can meet the
recognition requirements. These results indicate that the model can detect onboard equipment in real time
and perform lightweight tasks.