
Page 10 - Read Online
P. 10
Phadke et al. Intell Robot 2023;3:453-78 https://dx.doi.org/10.20517/ir.2023.27 Page 455
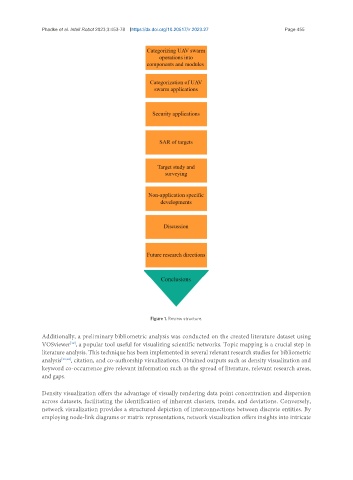
Figure 1. Review structure.
Additionally, a preliminary bibliometric analysis was conducted on the created literature dataset using
VOSviewer , a popular tool useful for visualizing scientific networks. Topic mapping is a crucial step in
[12]
literature analysis. This technique has been implemented in several relevant research studies for bibliometric
analysis [13,14] , citation, and co-authorship visualizations. Obtained outputs such as density visualization and
keyword co-occurrence give relevant information such as the spread of literature, relevant research areas,
and gaps.
Density visualization offers the advantage of visually rendering data point concentration and dispersion
across datasets, facilitating the identification of inherent clusters, trends, and deviations. Conversely,
network visualization provides a structured depiction of interconnections between discrete entities. By
employing node-link diagrams or matrix representations, network visualization offers insights into intricate