
Page 92 - Read Online
P. 92
Shu et al. Intell Robot 2024;4(1):74-86 I http://dx.doi.org/10.20517/ir.2024.05 Page 80
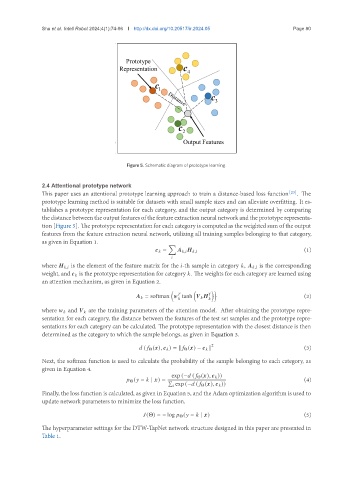
Figure 5. Schematic diagram of prototype learning.
2.4 Attentional prototype network
This paper uses an attentional prototype learning approach to train a distance-based loss function [23] . The
prototype learning method is suitable for datasets with small sample sizes and can alleviate overfitting. It es-
tablishes a prototype representation for each category, and the output category is determined by comparing
the distance between the output features of the feature extraction neural network and the prototype representa-
tion [Figure 5]. The prototype representation for each category is computed as the weighted sum of the output
features from the feature extraction neural network, utilizing all training samples belonging to that category,
as given in Equation 1.
∑
= , , (1)
where , is the element of the feature matrix for the -th sample in category , , is the corresponding
weight, and is the prototype representation for category . The weights for each category are learned using
an attention mechanism, as given in Equation 2.
( ( ))
= softmax tanh (2)
where and are the training parameters of the attention model. After obtaining the prototype repre-
sentation for each category, the distance between the features of the test set samples and the prototype repre-
sentations for each category can be calculated. The prototype representation with the closest distance is then
determined as the category to which the sample belongs, as given in Equation 3.
2 (3)
( Θ ( ), ) = ∥ Θ ( ) − ∥
Next, the softmax function is used to calculate the probability of the sample belonging to each category, as
given in Equation 4.
exp (− ( Θ ( ), ))
Θ ( = | ) = ∑ (4)
exp (− ( Θ ( ), ))
Finally, the loss function is calculated, as given in Equation 5, and the Adam optimization algorithm is used to
update network parameters to minimize the loss function.
(Θ) = − log Θ ( = | ) (5)
The hyperparameter settings for the DTW-TapNet network structure designed in this paper are presented in
Table 1.