
Page 63 - Read Online
P. 63
Tong et al. Intell Robot 2024;4:125-45 I http://dx.doi.org/10.20517/ir.2024.08 Page 141
400
0 0
300 −100 −100
200
−200
−200
100 −300 −300
−400 −400
0
−200 −100 0 100 200 300 400 0 100 200 300 400 −200 −100 0 100 200 300 400
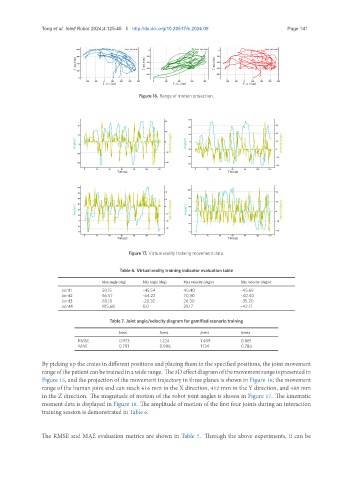
Figure 16. Range of motion projection.
60
40
60
40
40
20
40
20
20
20
0 0
Angle(°) 0 elocity(deg/s) Angle(°) elocity(deg/s)
−20 V −20 0 V
−20
−40
−20
−40
−40
−60
−40
0 20 40 60 80 100 120 0 20 40 60 80 100 120
Time(s) Time(s)
60
100
20 40
50
40 80
10
20
30
0
60
Angle(°) 20 Angle(°) 0
10 −10 elocity(deg/s) 40 elocity(deg/s)
0 V V
−20 −20
20
−10
−30
−40
−20 0
0 20 40 60 80 100 120 0 20 40 60 80 100 120
Time(s) Time(s)
Figure 17. Virtual reality training movement data.
Table 6. Virtual reality training indicator evaluation table
Max angle (deg) Min angle (deg) Max velocity (deg/s) Min velocity (deg/s)
Joint1 50.15 -45.54 40.40 -45.69
Joint2 56.57 -64.22 70.30 -40.40
Joint3 60.10 -20.32 26.30 -35.20
Joint4 105.68 0.0 29.17 -42.17
Table 7. Joint angle/velocity diagram for gamified scenario training
Joint1 Joint2 Joint3 Joint4
RMSE 0.973 1.224 1.489 0.881
MAE 0.791 0.986 1.124 0.786
By picking up the crates in different positions and placing them in the specified positions, the joint movement
rangeofthepatientcanbetrainedinawiderange. The3Deffectdiagramofthemovementrangeispresentedin
Figure 15, and the projection of the movement trajectory in three planes is shown in Figure 16; the movement
range of the human joint end can reach 616 mm in the X direction, 412 mm in the Y direction, and 488 mm
in the Z direction. The magnitude of motion of the robot joint angles is shown in Figure 17. The kinematic
moment data is displayed in Figure 18. The amplitude of motion of the first four joints during an interaction
training session is demonstrated in Table 6.
The RMSE and MAE evaluation metrics are shown in Table 7. Through the above experiments, it can be