
Page 76 - Read Online
P. 76
Page 419 Yang et al. Intell Robot 2024;4(4):406-21 I http://dx.doi.org/10.20517/ir.2024.24
(a) (b)
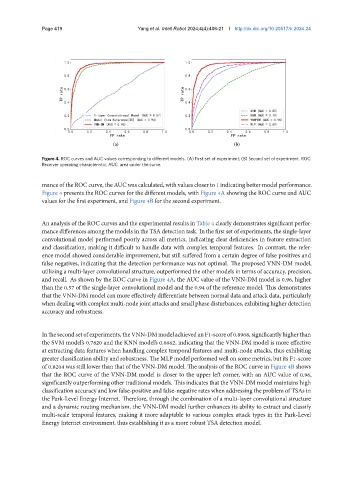
Figure 4. ROC curves and AUC values corresponding to different models. (A) First set of experiment; (B) Second set of experiment. ROC:
Receiver operating characteristic; AUC: area under the curve.
mance of the ROC curve, the AUC was calculated, with values closer to 1 indicating better model performance.
Figure 4 presents the ROC curves for the different models, with Figure 4A showing the ROC curve and AUC
values for the first experiment, and Figure 4B for the second experiment.
An analysis of the ROC curves and the experimental results in Table 4 clearly demonstrates significant perfor-
mance differences among the models in the TSA detection task. In the first set of experiments, the single-layer
convolutional model performed poorly across all metrics, indicating clear deficiencies in feature extraction
and classification, making it difficult to handle data with complex temporal features. In contrast, the refer-
ence model showed considerable improvement, but still suffered from a certain degree of false positives and
false negatives, indicating that the detection performance was not optimal. The proposed VNN-DM model,
utilizing a multi-layer convolutional structure, outperformed the other models in terms of accuracy, precision,
and recall. As shown by the ROC curve in Figure 4A, the AUC value of the VNN-DM model is 0.96, higher
than the 0.57 of the single-layer convolutional model and the 0.94 of the reference model. This demonstrates
that the VNN-DM model can more effectively differentiate between normal data and attack data, particularly
when dealing with complex multi-node joint attacks and small phase disturbances, exhibiting higher detection
accuracy and robustness.
Inthesecondsetofexperiments,theVNN-DMmodelachievedanF1-scoreof0.8968,significantlyhigherthan
the SVM model’s 0.7820 and the KNN model’s 0.6662, indicating that the VNN-DM model is more effective
at extracting data features when handling complex temporal features and multi-node attacks, thus exhibiting
greater classification ability and robustness. The MLP model performed well on some metrics, but its F1-score
of 0.8204 was still lower than that of the VNN-DM model. The analysis of the ROC curve in Figure 4B shows
that the ROC curve of the VNN-DM model is closer to the upper left corner, with an AUC value of 0.96,
significantly outperforming other traditional models. This indicates that the VNN-DM model maintains high
classification accuracy and low false-positive and false-negative rates when addressing the problem of TSAs in
the Park-Level Energy Internet. Therefore, through the combination of a multi-layer convolutional structure
and a dynamic routing mechanism, the VNN-DM model further enhances its ability to extract and classify
multi-scale temporal features, making it more adaptable to various complex attack types in the Park-Level
Energy Internet environment, thus establishing it as a more robust TSA detection model.