
Page 75 - Read Online
P. 75
Yang et al. Intell Robot 2024;4(4):406-21 I http://dx.doi.org/10.20517/ir.2024.24 Page 418
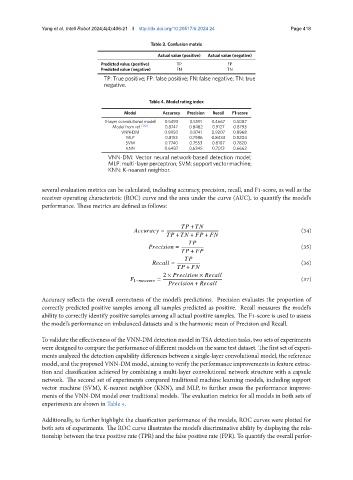
Table 3. Confusion matrix
Actual value (positive) Actual value (negative)
Predicted value (positive) TP FP
Predicted value (negative) FN TN
TP: True positive; FP: false positive; FN: false negative; TN: true
negative.
Table 4. Model rating index
Model Accuracy Precision Recall F1-score
1-layer convolutional model 0.5493 0.5591 0.4667 0.5087
Model from ref. [20] 0.8747 0.8482 0.9127 0.8793
VNN-DM 0.8950 0.8741 0.9207 0.8968
MLP 0.8153 0.7986 0.8433 0.8204
SVM 0.7740 0.7553 0.8107 0.7820
KNN 0.6487 0.6345 0.7013 0.6662
VNN-DM: Vector neural network-based detection model;
MLP: multi-layer perceptron; SVM: support vector machine;
KNN: K-nearest neighbor.
several evaluation metrics can be calculated, including accuracy, precision, recall, and F1-score, as well as the
receiver operating characteristic (ROC) curve and the area under the curve (AUC), to quantify the model’s
performance. These metrics are defined as follows:
+
= (34)
+ + +
= (35)
+
= (36)
+
2 × ×
1− = (37)
+
Accuracy reflects the overall correctness of the model’s predictions. Precision evaluates the proportion of
correctly predicted positive samples among all samples predicted as positive. Recall measures the model’s
ability to correctly identify positive samples among all actual positive samples. The F1-score is used to assess
the model’s performance on imbalanced datasets and is the harmonic mean of Precision and Recall.
To validate the effectiveness of the VNN-DM detection model in TSA detection tasks, two sets of experiments
were designed to compare the performance of different models on the same test dataset. The first set of experi-
ments analyzed the detection capability differences between a single-layer convolutional model, the reference
model, and the proposed VNN-DM model, aiming to verify the performance improvements in feature extrac-
tion and classification achieved by combining a multi-layer convolutional network structure with a capsule
network. The second set of experiments compared traditional machine learning models, including support
vector machine (SVM), K-nearest neighbor (KNN), and MLP, to further assess the performance improve-
ments of the VNN-DM model over traditional models. The evaluation metrics for all models in both sets of
experiments are shown in Table 4.
Additionally, to further highlight the classification performance of the models, ROC curves were plotted for
both sets of experiments. The ROC curve illustrates the model’s discriminative ability by displaying the rela-
tionship between the true positive rate (TPR) and the false positive rate (FPR). To quantify the overall perfor-