
Page 74 - Read Online
P. 74
Page 417 Yang et al. Intell Robot 2024;4(4):406-21 I http://dx.doi.org/10.20517/ir.2024.24
Table 2. Training data set
Data type Training data Test data
Measure data 12000 3000
Attack data 12000 3000
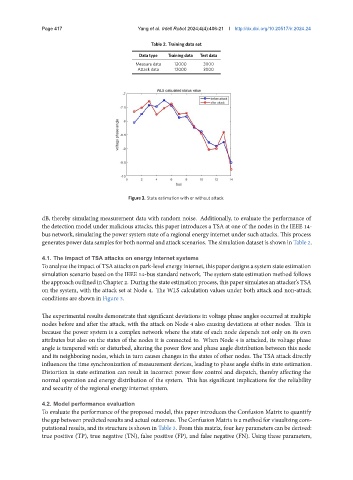
Figure 3. State estimation with or without attack.
dB, thereby simulating measurement data with random noise. Additionally, to evaluate the performance of
the detection model under malicious attacks, this paper introduces a TSA at one of the nodes in the IEEE 14-
bus network, simulating the power system state of a regional energy internet under such attacks. This process
generates power data samples for both normal and attack scenarios. The simulation dataset is shown in Table 2.
4.1. The impact of TSA attacks on energy internet systems
ToanalyzetheimpactofTSAattacksonpark-levelenergy internet, thispaperdesignsasystemstateestimation
simulation scenario based on the IEEE 14-bus standard network. The system state estimation method follows
the approach outlined in Chapter 2. During the state estimation process, this paper simulates an attacker’s TSA
on the system, with the attack set at Node 4. The WLS calculation values under both attack and non-attack
conditions are shown in Figure 3.
The experimental results demonstrate that significant deviations in voltage phase angles occurred at multiple
nodes before and after the attack, with the attack on Node 4 also causing deviations at other nodes. This is
because the power system is a complex network where the state of each node depends not only on its own
attributes but also on the states of the nodes it is connected to. When Node 4 is attacked, its voltage phase
angle is tampered with or disturbed, altering the power flow and phase angle distribution between this node
and its neighboring nodes, which in turn causes changes in the states of other nodes. The TSA attack directly
influences the time synchronization of measurement devices, leading to phase angle shifts in state estimation.
Distortion in state estimation can result in incorrect power flow control and dispatch, thereby affecting the
normal operation and energy distribution of the system. This has significant implications for the reliability
and security of the regional energy internet system.
4.2. Model performance evaluation
To evaluate the performance of the proposed model, this paper introduces the Confusion Matrix to quantify
the gap between predicted results and actual outcomes. The Confusion Matrix is a method for visualizing com-
putational results, and its structure is shown in Table 3. From this matrix, four key parameters can be derived:
true positive (TP), true negative (TN), false positive (FP), and false negative (FN). Using these parameters,