
Page 178 - Read Online
P. 178
Li et al. Intell Robot 2024;4(3):230-43 I http://dx.doi.org/10.20517/ir.2024.15 Page 238
12 Sobriety
Steering wheel cornering(°) 4 Very fatigue
Fatigue
8
0
-4
Time length (71s)
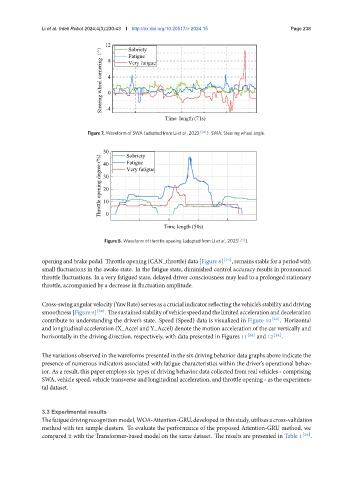
Figure 7. Waveform of SWA (adapted from Li et al., 2023 [24] ). SWA: Steering wheel angle.
50 Sobriety
Throttle opening degree (%) 30 Very fatigue
Fatigue
40
20
10
0
Time length (50s)
Figure 8. Waveform of throttle opening (adapted from Li et al., 2023 [24] ).
openingandbrakepedal. Throttleopening(CAN_throttle)data[Figure8] [24] , remainsstableforaperiodwith
small fluctuations in the awake state. In the fatigue state, diminished control accuracy results in pronounced
throttle fluctuations. In a very fatigued state, delayed driver consciousness may lead to a prolonged stationary
throttle, accompanied by a decrease in fluctuation amplitude.
Cross-swingangularvelocity(YawRate)servesasacrucialindicatorreflectingthevehicle’sstabilityanddriving
smoothness[Figure9] [24] . Thesustainedstabilityofvehiclespeedandthelimitedaccelerationanddeceleration
contribute to understanding the driver’s state. Speed (Speed) data is visualized in Figure 10 [24] . Horizontal
and longitudinal acceleration (X_Accel and Y_Accel) denote the motion acceleration of the car vertically and
horizontally in the driving direction, respectively, with data presented in Figures 11 [24] and 12 [24] .
The variations observed in the waveforms presented in the six driving behavior data graphs above indicate the
presence of numerous indicators associated with fatigue characteristics within the driver’s operational behav-
ior. As a result, this paper employs six types of driving behavior data collected from real vehicles - comprising
SWA, vehicle speed, vehicle transverse and longitudinal acceleration, and throttle opening - as the experimen-
tal dataset.
3.3 Experimental results
Thefatiguedrivingrecognitionmodel,WOA-Attention-GRU,developedinthisstudy,utilizesacross-validation
method with ten sample clusters. To evaluate the performance of the proposed Attention-GRU method, we
compared it with the Transformer-based model on the same dataset. The results are presented in Table 1 [24] .