
Page 179 - Read Online
P. 179
Page 239 Li et al. Intell Robot 2024;4(3):230-43 I http://dx.doi.org/10.20517/ir.2024.15
3.0 Sobriety
Angular velocity of pendulum -1.5
Fatigue
1.5
Very fatigue
0.0
-3.0
Time length (60s)
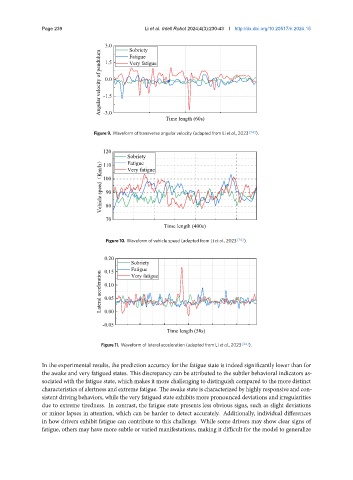
Figure 9. Waveform of transverse angular velocity (adapted from Li et al., 2023 [24] ).
120
Sobriety
Vehicle speed(Km/h) 100
Fatigue
110
Very fatigue
90
80
70
Time length (400s)
Figure 10. Waveform of vehicle speed (adapted from Li et al., 2023 [24] ).
0.20
Sobriety
Fatigue
0.15
Lateral acceleration 0.10
Very fatigue
0.05
0.00
-0.05
Time length (58s)
Figure 11. Waveform of lateral acceleration (adapted from Li et al., 2023 [24] ).
In the experimental results, the prediction accuracy for the fatigue state is indeed significantly lower than for
the awake and very fatigued states. This discrepancy can be attributed to the subtler behavioral indicators as-
sociated with the fatigue state, which makes it more challenging to distinguish compared to the more distinct
characteristics of alertness and extreme fatigue. The awake state is characterized by highly responsive and con-
sistent driving behaviors, while the very fatigued state exhibits more pronounced deviations and irregularities
due to extreme tiredness. In contrast, the fatigue state presents less obvious signs, such as slight deviations
or minor lapses in attention, which can be harder to detect accurately. Additionally, individual differences
in how drivers exhibit fatigue can contribute to this challenge. While some drivers may show clear signs of
fatigue, others may have more subtle or varied manifestations, making it difficult for the model to generalize