
Page 180 - Read Online
P. 180
Li et al. Intell Robot 2024;4(3):230-43 I http://dx.doi.org/10.20517/ir.2024.15 Page 240
0.15
Sobriety
Longitudinal acceleration 0.05
Fatigue
0.10
Very fatigue
0.00
-0.05
Time length (80s)
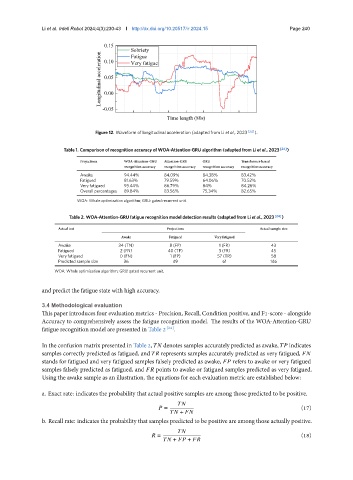
Figure 12. Waveform of longitudinal acceleration (adapted from Li et al., 2023 [24] ).
Table 1. Comparison of recognition accuracy of WOA-Attention-GRU algorithm (adapted from Li et al., 2023 [24] )
Projections WOA-Attention-GRU Attention-GRU GRU Transformer-based
recognition accuracy recognition accuracy recognition accuracy recognition accuracy
Awake 94.44% 84.09% 84.38% 83.42%
Fatigued 81.63% 79.59% 64.06% 70.52%
Very fatigued 93.44% 86.79% 84% 84.26%
Overall percentages 89.84% 83.56% 75.34% 82.65%
WOA: Whale optimization algorithm; GRU: gated recurrent unit.
Table 2. WOA-Attention-GRU fatigue recognition model detection results (adapted from Li et al., 2023 [24] )
Actual test Projections Actual sample size
Awake Fatigued Very fatigued
Awake 34 (TN) 8 (FP) 1 (FR) 43
Fatigued 2 (FN) 40 (TP) 3 (FR) 45
Very fatigued 0 (FN) 1 (FP) 57 (TR) 58
Predicted sample size 36 49 61 146
WOA: Whale optimization algorithm; GRU: gated recurrent unit.
and predict the fatigue state with high accuracy.
3.4 Methodological evaluation
This paper introduces four evaluation metrics - Precision, Recall, Condition positive, and F1-score - alongside
Accuracy to comprehensively assess the fatigue recognition model. The results of the WOA-Attention-GRU
fatigue recognition model are presented in Table 2 [24] .
In the confusion matrix presented in Table 2, denotes samples accurately predicted as awake, indicates
samples correctly predicted as fatigued, and represents samples accurately predicted as very fatigued,
stands for fatigued and very fatigued samples falsely predicted as awake, refers to awake or very fatigued
samples falsely predicted as fatigued, and points to awake or fatigued samples predicted as very fatigued.
Using the awake sample as an illustration, the equations for each evaluation metric are established below:
a. Exact rate: indicates the probability that actual positive samples are among those predicted to be positive.
= (17)
+
b. Recall rate: indicates the probability that samples predicted to be positive are among those actually positive.
= (18)
+ + 